
Page 342 - Mechanics of Asphalt Microstructure and Micromechanics
P. 342
T
334 Ch a p t e r e n
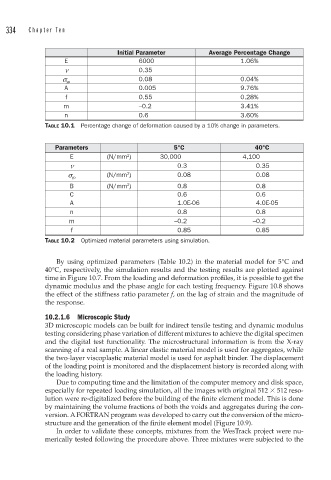
Initial Parameter Average Percentage Change
E 6000 1.06%
n 0.35
0.08 0.04%
s yp
A 0.005 9.76%
f 0.55 0.28%
m –0.2 3.41%
n 0.6 3.60%
TABLE 10.1 Percentage change of deformation caused by a 10% change in parameters.
Parameters 5°C 40°C
E (N/mm ) 30,000 4,100
2
n 0.3 0.35
2
(N/mm ) 0.08 0.08
s yp
B (N/mm ) 0.8 0.8
2
C 0.6 0.6
A 1.0E-06 4.0E-05
n 0.8 0.8
m –0.2 –0.2
f 0.85 0.85
TABLE 10.2 Optimized material parameters using simulation.
By using optimized parameters (Table 10.2) in the material model for 5°C and
40°C, respectively, the simulation results and the testing results are plotted against
time in Figure 10.7. From the loading and deformation profiles, it is possible to get the
dynamic modulus and the phase angle for each testing frequency. Figure 10.8 shows
the effect of the stiffness ratio parameter f, on the lag of strain and the magnitude of
the response.
10.2.1.6 Microscopic Study
3D microscopic models can be built for indirect tensile testing and dynamic modulus
testing considering phase variation of different mixtures to achieve the digital specimen
and the digital test functionality. The microstructural information is from the X-ray
scanning of a real sample. A linear elastic material model is used for aggregates, while
the two-layer viscoplastic material model is used for asphalt binder. The displacement
of the loading point is monitored and the displacement history is recorded along with
the loading history.
Due to computing time and the limitation of the computer memory and disk space,
especially for repeated loading simulation, all the images with original 512 512 reso-
lution were re-digitalized before the building of the finite element model. This is done
by maintaining the volume fractions of both the voids and aggregates during the con-
version. A FORTRAN program was developed to carry out the conversion of the micro-
structure and the generation of the finite element model (Figure 10.9).
In order to validate these concepts, mixtures from the WesTrack project were nu-
merically tested following the procedure above. Three mixtures were subjected to the