
Page 341 - Mechanics of Asphalt Microstructure and Micromechanics
P. 341
Digital Specimen and Digital T est-Integration of Microstructure into Simulation 333
First, an initial simulation profile was obtained with a set of parameters that are
typical values for AC. Second, sensitivity analysis of each parameter was conducted
to find the effect of each parameter to the simulation results. Finally, a series of simula-
tions were carried out to obtain the set of parameters leading to the minimization of
the objective function. More details on back calculation are presented in Section
10.3.3.
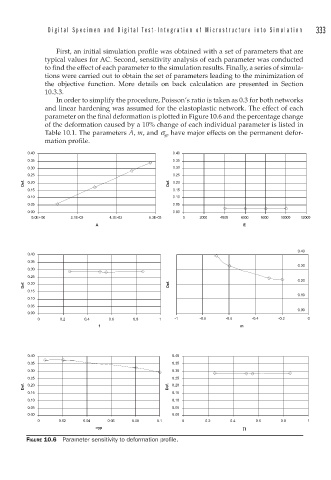
In order to simplify the procedure, Poisson’s ratio is taken as 0.3 for both networks
and linear hardening was assumed for the elastoplastic network. The effect of each
parameter on the final deformation is plotted in Figure 10.6 and the percentage change
of the deformation caused by a 10% change of each individual parameter is listed in
Table 10.1. The parameters A, m, and s yp have major effects on the permanent defor-
mation profile.
0.40 0.40
0.35 0.35
0.30 0.30
0.25 0.25
Def. 0.20 Def. 0.20
0.15 0.15
0.10 0.10
0.05 0.05
0.00 0.00
0.0E+00 2.1E-03 4.2E-03 6.3E-03 0 2000 4000 6000 8000 10000 12000
A E
0.40
0.40
0.35
0.30
0.30
0.25
Def. 0.20 Def. 0.20
0.15
0.10
0.10
0.05
0.00
0.00
0 0.2 0.4 0.6 0.8 1 -1 -0.8 -0.6 -0.4 -0.2 0
f m
0.40 0.40
0.35 0.35
0.30 0.30
0.25 0.25
Def. 0.20 Def. 0.20
0.15 0.15
0.10 0.10
0.05 0.05
0.00 0.00
0 0.02 0.04 0.06 0.08 0.1 0 0.2 0.4 0.6 0.8 1
n
σyp f
FIGURE 10.6 Parameter sensitivity to deformation profi le.