
Page 340 - Mechanics of Asphalt Microstructure and Micromechanics
P. 340
T
332 Ch a p t e r e n
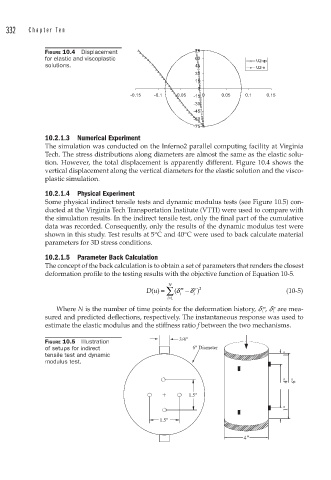
FIGURE 10.4 Displacement 75
for elastic and viscoplastic 60 U2-vp
solutions. 45 U2-e
30
15
0
-0.15 -0.1 -0.05 -15 0 0.05 0.1 0.15
-30
-45
-60
-75
10.2.1.3 Numerical Experiment
The simulation was conducted on the Inferno2 parallel computing facility at Virginia
Tech. The stress distributions along diameters are almost the same as the elastic solu-
tion. However, the total displacement is apparently different. Figure 10.4 shows the
vertical displacement along the vertical diameters for the elastic solution and the visco-
plastic simulation.
10.2.1.4 Physical Experiment
Some physical indirect tensile tests and dynamic modulus tests (see Figure 10.5) con-
ducted at the Virginia Tech Transportation Institute (VTTI) were used to compare with
the simulation results. In the indirect tensile test, only the final part of the cumulative
data was recorded. Consequently, only the results of the dynamic modulus test were
shown in this study. Test results at 5°C and 40°C were used to back calculate material
parameters for 3D stress conditions.
10.2.1.5 Parameter Back Calculation
The concept of the back calculation is to obtain a set of parameters that renders the closest
deformation profile to the testing results with the objective function of Equation 10-5.
N
Du () = ∑ (δ i m −δ i p 2 (10-5)
)
i=1
m
p
Where N is the number of time points for the deformation history, d i , d i are mea-
sured and predicted deflections, respectively. The instantaneous response was used to
estimate the elastic modulus and the stiffness ratio f between the two mechanisms.
3/4"
FIGURE 10.5 Illustration
of setups for indirect 6" Diameter
tensile test and dynamic 1"
modulus test.
4" 6"
1.5"
1"
1.5"
4"