
Page 345 - Mechanics of Asphalt Microstructure and Micromechanics
P. 345
Digital Specimen and Digital T est-Integration of Microstructure into Simulation 337
0.0006
0.0005
0.0004
Displacement (mm) 0.0003 32
48
80
0.0002
0.0001
0
0 1 2 3 4 5
Time (s)
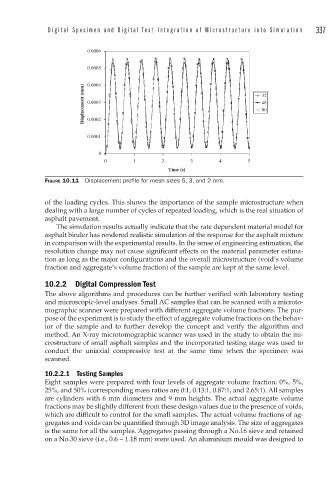
FIGURE 10.11 Displacement profi le for mesh sizes 5, 3, and 2 mm.
of the loading cycles. This shows the importance of the sample microstructure when
dealing with a large number of cycles of repeated loading, which is the real situation of
asphalt pavement.
The simulation results actually indicate that the rate dependent material model for
asphalt binder has rendered realistic simulation of the response for the asphalt mixture
in comparison with the experimental results. In the sense of engineering estimation, the
resolution change may not cause significant effects on the material parameter estima-
tion as long as the major configurations and the overall microstructure (void’s volume
fraction and aggregate’s volume fraction) of the sample are kept at the same level.
10.2.2 Digital Compression Test
The above algorithms and procedures can be further verified with laboratory testing
and microscopic-level analyses. Small AC samples that can be scanned with a microto-
mographic scanner were prepared with different aggregate volume fractions. The pur-
pose of the experiment is to study the effect of aggregate volume fractions on the behav-
ior of the sample and to further develop the concept and verify the algorithm and
method. An X-ray microtomographic scanner was used in the study to obtain the mi-
crostructure of small asphalt samples and the incorporated testing stage was used to
conduct the uniaxial compressive test at the same time when the specimen was
scanned.
10.2.2.1 Testing Samples
Eight samples were prepared with four levels of aggregate volume fraction: 0%, 5%,
25%, and 50% (corresponding mass ratios are 0:1, 0.13:1, 0.87:1, and 2.65:1). All samples
are cylinders with 6 mm diameters and 9 mm heights. The actual aggregate volume
fractions may be slightly different from these design values due to the presence of voids,
which are difficult to control for the small samples. The actual volume fractions of ag-
gregates and voids can be quantified through 3D image analysis. The size of aggregates
is the same for all the samples. Aggregates passing through a No.16 sieve and retained
on a No.30 sieve (i.e., 0.6 ~ 1.18 mm) were used. An aluminium mould was designed to