
Page 349 - Mechanics of Asphalt Microstructure and Micromechanics
P. 349
Digital Specimen and Digital T est-Integration of Microstructure into Simulation 341
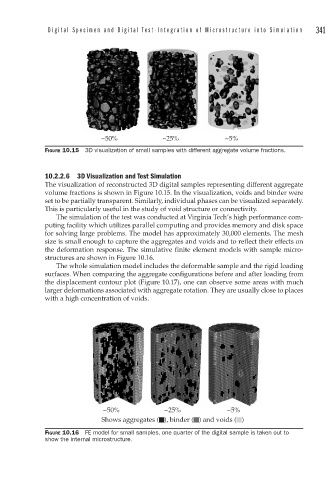
~50% ~25% ~5%
FIGURE 10.15 3D visualization of small samples with different aggregate volume fractions.
10.2.2.6 3D Visualization and Test Simulation
The visualization of reconstructed 3D digital samples representing different aggregate
volume fractions is shown in Figure 10.15. In the visualization, voids and binder were
set to be partially transparent. Similarly, individual phases can be visualized separately.
This is particularly useful in the study of void structure or connectivity.
The simulation of the test was conducted at Virginia Tech’s high performance com-
puting facility which utilizes parallel computing and provides memory and disk space
for solving large problems. The model has approximately 30,000 elements. The mesh
size is small enough to capture the aggregates and voids and to reflect their effects on
the deformation response. The simulative finite element models with sample micro-
structures are shown in Figure 10.16.
The whole simulation model includes the deformable sample and the rigid loading
surfaces. When comparing the aggregate configurations before and after loading from
the displacement contour plot (Figure 10.17), one can observe some areas with much
larger deformations associated with aggregate rotation. They are usually close to places
with a high concentration of voids.
~50% ~25% ~5%
Shows aggregates ( ), binder ( ) and voids ( )
FIGURE 10.16 FE model for small samples, one quarter of the digital sample is taken out to
show the internal microstructure.