
Page 354 - Mechanics of Asphalt Microstructure and Micromechanics
P. 354
T
346 Ch a p t e r e n
120000
Computation Time (Sec.) 80000
100000
60000
40000
20000
0
0.0E+00 4.0E+04 8.0E+04 1.2E+05 1.6E+05
Element Number
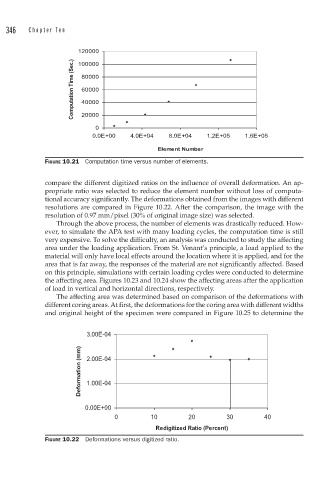
FIGURE 10.21 Computation time versus number of elements.
compare the different digitized ratios on the influence of overall deformation. An ap-
propriate ratio was selected to reduce the element number without loss of computa-
tional accuracy significantly. The deformations obtained from the images with different
resolutions are compared in Figure 10.22. After the comparison, the image with the
resolution of 0.97 mm/pixel (30% of original image size) was selected.
Through the above process, the number of elements was drastically reduced. How-
ever, to simulate the APA test with many loading cycles, the computation time is still
very expensive. To solve the difficulty, an analysis was conducted to study the affecting
area under the loading application. From St. Venant’s principle, a load applied to the
material will only have local effects around the location where it is applied, and for the
area that is far away, the responses of the material are not significantly affected. Based
on this principle, simulations with certain loading cycles were conducted to determine
the affecting area. Figures 10.23 and 10.24 show the affecting areas after the application
of load in vertical and horizontal directions, respectively.
The affecting area was determined based on comparison of the deformations with
different coring areas. At first, the deformations for the coring area with different widths
and original height of the specimen were compared in Figure 10.25 to determine the
3.00E-04
Deformation (mm) 2.00E-04
1.00E-04
0.00E+00
0 10 20 30 40
Redigitized Ratio (Percent)
FIGURE 10.22 Deformations versus digitized ratio.