
Page 359 - Mechanics of Asphalt Microstructure and Micromechanics
P. 359
Digital Specimen and Digital T est-Integration of Microstructure into Simulation 351
0.12
0.1
Defromation (mm) 0.08
0.06
0.04
0.02
0
0 100 200 300 400
Cycles
Core_1 Core_2 Core_3
Core_4 Average Deformation Core_5
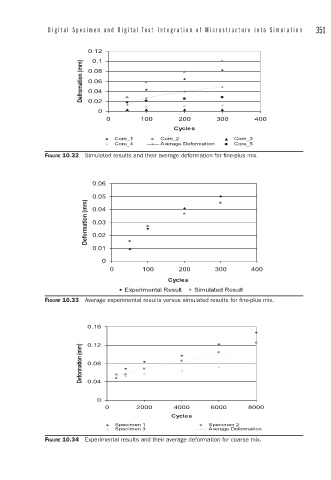
FIGURE 10.32 Simulated results and their average deformation for fi ne-plus mix.
0.06
0.05
Deformation (mm) 0.03
0.04
0.02
0.01
0
0 100 200 300 400
Cycles
Experimental Result Simulated Result
FIGURE 10.33 Average experimental results versus simulated results for fi ne-plus mix.
0.16
Deformation (mm) 0.12
0.08
0.04
0
0 2000 4000 6000 8000
Cycles
Specimen 1 Specimen 2
Specimen 3 Average Deformation
FIGURE 10.34 Experimental results and their average deformation for coarse mix.