
Page 344 - Mechanics of Asphalt Microstructure and Micromechanics
P. 344
T
336 Ch a p t e r e n
FIGURE 10.9 Microscopic
FE model for the indirect
tensile test.
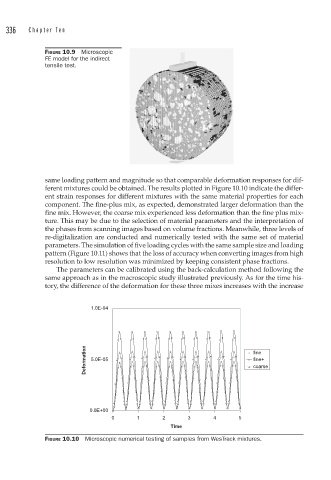
same loading pattern and magnitude so that comparable deformation responses for dif-
ferent mixtures could be obtained. The results plotted in Figure 10.10 indicate the differ-
ent strain responses for different mixtures with the same material properties for each
component. The fine-plus mix, as expected, demonstrated larger deformation than the
fine mix. However, the coarse mix experienced less deformation than the fine plus mix-
ture. This may be due to the selection of material parameters and the interpretation of
the phases from scanning images based on volume fractions. Meanwhile, three levels of
re-digitalization are conducted and numerically tested with the same set of material
parameters. The simulation of five loading cycles with the same sample size and loading
pattern (Figure 10.11) shows that the loss of accuracy when converting images from high
resolution to low resolution was minimized by keeping consistent phase fractions.
The parameters can be calibrated using the back-calculation method following the
same approach as in the macroscopic study illustrated previously. As for the time his-
tory, the difference of the deformation for these three mixes increases with the increase
1.0E-04
Deformation 5.0E-05 fine
fine+
coarse
0.0E+00
0 1 2 3 4 5
Time
FIGURE 10.10 Microscopic numerical testing of samples from WesTrack mixtures.