
Page 95 - Mechanics of Asphalt Microstructure and Micromechanics
P. 95
88 Ch a p t e r Th r e e
3.5.2 Specific Damaged Surface Area
The specific damaged surface area (damaged surface area per unit volume) is an overall
evaluation of the severity of the damaged continuum. From a purely geometric point of
view, the larger the specific damaged surface area, the more severe the damage. How-
ever, from the mechanical point of view, the influence of a naturally embedded void on
the mechanical behavior of the material may significantly differ from that of an active
crack. Generally speaking, the distribution of the damaged surface areas around the
orientations is not uniform. If the distribution can be approximated by a second-order
fabric tensor, the distribution may be represented as:
S
Sn() = v ( + Sn n ) (3-36)
1
4π ij i j
Where S(n) is the distribution density function of the specific damaged surface area.
n is the unit normal to a unit sphere, and n i and n j are the directional cosines. S v, is the
specific damaged surface area. S ij is the second-order fabric tensor representing the ori-
entational variation of the distribution. In brief, the distribution function has two pa-
rameters: the specific damaged surface area S v and its anisotropic characteristics repre-
sented as the fabric tensor S ij .
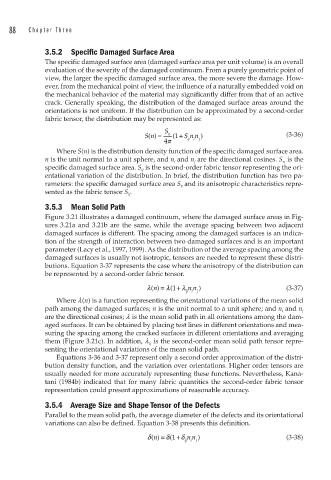
3.5.3 Mean Solid Path
Figure 3.21 illustrates a damaged continuum, where the damaged surface areas in Fig-
ures 3.21a and 3.21b are the same, while the average spacing between two adjacent
damaged surfaces is different. The spacing among the damaged surfaces is an indica-
tion of the strength of interaction between two damaged surfaces and is an important
parameter (Lacy et al., 1997, 1999). As the distribution of the average spacing among the
damaged surfaces is usually not isotropic, tensors are needed to represent these distri-
butions. Equation 3-37 represents the case where the anisotropy of the distribution can
be represented by a second-order fabric tensor.
λ() = λ( + λ n n ) (3-37)
1
n
ij i j
Where l(n) is a function representing the orientational variations of the mean solid
path among the damaged surfaces; n is the unit normal to a unit sphere; and n i and n j
are the directional cosines; l is the mean solid path in all orientations among the dam-
aged surfaces. It can be obtained by placing test lines in different orientations and mea-
suring the spacing among the cracked surfaces in different orientations and averaging
them (Figure 3.21c). In addition, l ij is the second-order mean solid path tensor repre-
senting the orientational variations of the mean solid path.
Equations 3-36 and 3-37 represent only a second order approximation of the distri-
bution density function, and the variation over orientations. Higher order tensors are
usually needed for more accurately representing these functions. Nevertheless, Kana-
tani (1984b) indicated that for many fabric quantities the second-order fabric tensor
representation could present approximations of reasonable accuracy.
3.5.4 Average Size and Shape Tensor of the Defects
Parallel to the mean solid path, the average diameter of the defects and its orientational
variations can also be defined. Equation 3-38 presents this definition.
1
δ() = δ( + δ n n ) (3-38)
n
ij i j