
Page 171 - Mechanism and Theory in Organic Chemistry
P. 171
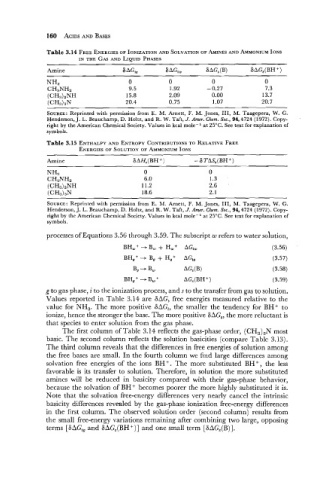
Table 3.14 FREE ENERGIES IONIZATION AND SOLVATION AMINES AND AMMONIUM IONS
                                                             OF
                                     OF
                         IN  THE  GAS AND  LIQUID PHASES
               Amine                  6 AGi,       6AGiw       ~AGs(B)      6AGS(BHC)
               NH3                      0           0           0               0
               CH3NHz                   9.5         1.92       - 0.27           7.3
               (CH3)zNH                15.8         2.09        0.00           13.7
               (CH3)3N                 20.4         0.75         1.07          20.7
               SOURCE: Reprinted with permission from E.  M. Arnett, F.  M. Jones,  111,  M.  Taagepera, W.  G.
               Henderson, J. L. Beauchamp, D. Holtz, and R. W. Taft, J. Amer.  Chem. Soc.,  94,4724 (1972). Copy-
               right by the American Chemical Society. Values in kcal mole- l at 25°C. See text for explanation of
               symbols.
               Table 3.15  ENTHALPY AND  ENTROPY CONTRIBUTIONS RELATIVE FREE
                                                          TO
                         ENERGIES  SOLUTION OF AMMONIUM IONS
                                 OF
               -  -
               Amine
               NH3                          0                   0
               CH3NH2                       6.0                 1.3
                (CH3)2NH                    11.2                2.6
                (CH3)3N                     18.6                2.1
               SOURCE: Reprinted with permission from E. RI.  Arnett, F. M. Jones,  111,  M. Taagepera, W. G.
               Henderson, J. L. Beauchamp, D, Holtz, and R. W. Taft, J. Amer. Chem. Soc.,  94,4724 (1972). Copy-
               right by the American Chemical Society. Values in kcal mole-'  at 25°C. See text for explanation of
               symbols.

               processes of Equations 3.56 through 3.59. Thc subscript w refers to water solution,


                                                        AG,(BH + )                (3.59)
                                      BH, + -+ Bw +
               g to gas phase, i to the ionization process, and s to the transfer from gas to solution.
               Values  reported  in Table 3.14 are  SAG, free energies measured  relative to the
               value  for NH,.  The more  positive  SAGi, the smaller  the tendency  for BH+ to
               ionize, hence the stronger the base. The more positive SAG,,  the more reluctant is
               that species to enter solution from thc gas phase.
                    The first column of Table 3.14 reflects the gas-phase order, (CH,),N  most
               basic.  The second column reflects the solution basicities  (compare Table 3.13).
               The third column reveals that the differences in free energies of solution among
               the free bases are small. In the fourth column we find  large differences among
               solvation  free  energies  of  the  ions  BH+. The more  substituted  BH+, the  less
               favorable is  its  transfer  to solution.  Therefore, in solution  the more substituted
               amincs  will  be  reduced  in  basicity  compared  with  their  gas-phase  behavior,
               because the solvation of BH+ becomes poorer  the more highly substituted it is.
               Note  that the solvation free-cncrgy differences very  nearly  cancel the intrinsic
               basicity  differences revealed  by  the gas-phase ionization free-energy differences
               in  the first column.  The observed  solution order  (second column) results from
               the small free-energy variations remaining after combining two large, opposing
               terms  [SAG,,  and SAG,(BH+)] and one small term  [GAG,(B)].