
Page 199 - Mechatronics for Safety, Security and Dependability in a New Era
P. 199
Ch38-I044963.fm Page 183 Tuesday, August 1, 2006 8:18 PM
1, 2006
8:18 PM
Tuesday, August
Page 183
Ch38-I044963.fm
183
183
As shown in Figure 1 it corresponds to square measure of the hypotenuse in right triangle which
includes Afi and a-Awi of two sides. The logarithm in the equation is applied since the square
measure A u t varies more widely as the value becomes larger. From the results of various driving
simulations it is found that the driving performance is classified under the following five qualitative
assessments. That is stable vs. U < 0.1, somewhat unstable vs. 0.1 Ssf/<0.3, unstable vs. 0.3^L'<0.5,
rather unstable vs. 0.5±=f7<0.7, and much unstable vs. 0.75= U.
3.2 Reaction time
Driver perception reaction time is one of the essential factors for the drunk driving or talking driving
with a cell phone. The time lag of pressing the brake pedal with a foot is measured. Drivers do not
perform the driving task but only press the brake pedal during watching a colored circle( 0 300)
displayed on the screen. Subjects are asked to press the brake pedal with a right foot immediately
when the color of the circle is changed.
4. FEASIBILITY TEST
Using the driving simulator experiments were carried out to demonstrate that the evaluations of drunk
driving or talking driving with a cell phone were appropriate. Six male subjects participated in this
study. They were all right handed and were aged between 20 and 40 years. Firstly, the degree of
unsteadiness Z/was assessed. The talking tasks through the cell phone were arithmetic questions. The
subjects were asked to reply the number added 1 to each figure of a certain number; e.g. 8 for 7, 73 for
62, and 397 for 286. The number of the figures corresponds to the talking task level 1, 2, and 3. On the
other hand, under the condition of DUl(Driving Under the Influence of alcohol), two drunken levels
i.e. above 0.15mg/l and above 0.25mg/l were adopted.
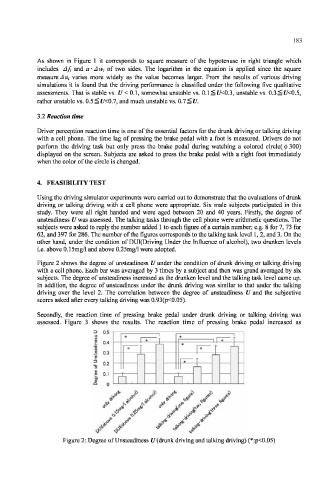
Figure 2 shows the degree of unsteadiness U under the condition of drunk driving or talking driving
with a cell phone. Each bar was averaged by 3 times by a subject and then was grand averaged by six
subjects. The degree of unsteadiness increased as the drunken level and the talking task level came up.
In addition, the degree of unsteadiness under the drunk driving was similar to that under the talking
driving over the level 2. The correlation between the degree of unsteadiness U and the subjective
scores asked after every talking driving was 0.93(p<0.05).
Secondly, the reaction time of pressing brake pedal under drunk driving or talking driving was
assessed. Figure 3 shows the results. The reaction time of pressing brake pedal increased as
_) 0.5 —i —i
W
0.4 -—^=t—
stead 0.3 -• 1 ^V-
Un
of
Degree 0.1
s< B
y
/
Figure 2: Degree of Unsteadiness U (drunk driving and talking driving) (*:p<0.05)