
Page 61 - Mechatronics for Safety, Security and Dependability in a New Era
P. 61
Ch10-I044963.fm Page 45 Tuesday, August 1, 2006 8:42 PM
Page 45
8:42 PM
Tuesday, August
Ch10-I044963.fm
1, 2006
45
45
step responses of body movement against the step forward movement of the sliders. The subject's
movement is detected by ultrasonic sensor fixed in front of experimental system. Meanwhile, we
record the reducing of pushing force to identify the reducing pushing force dynamics.
RESULTS
Identification of Model Elements
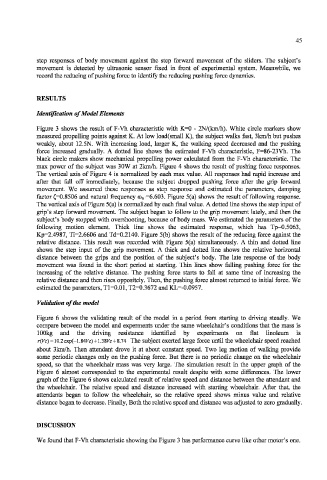
Figure 3 shows the result of F-Vh characteristic with K=0 - 2N/(km/h). White circle markers show
measured propelling points against K. At low load(small K), the subject walks fast, 3km/h but pushes
weakly, about 12.5N. With increasing load, larger K, the walking speed decreased and the pushing
force increased gradually. A dotted line shows the estimated F-Vh characteristic, F=86-23Vh. The
black circle makers show mechanical propelling power calculated from the F-Vh characteristic. The
max power of the subject was 30W at 2km/h. Figure 4 shows the result of pushing force responses.
The vertical axis of Figure 4 is normalized by each max value. All responses had rapid increase and
after that fall off immediately, because the subject dropped pushing force after the grip forward
movement. We assumed these responses as step response and estimated the parameters, damping
factor (^=0.8506 and natural frequency co n =6.603. Figure 5(a) shows the result of following response.
The vertical axis of Figure 5(a) is normalized by each final value. A dotted line shows the step input of
grip's step forward movement. The subject began to follow to the grip movement lately, and then the
subject's body stopped with overshooting, because of body mass. We estimated the parameters of the
following motion element. Thick line shows the estimated response, which has Tp=0.5063,
Kp=2.4987, Ti=2.6606 and Td=0.2140. Figure 5(b) shows the result of the reducing force against the
relative distance. This result was recorded with Figure 5(a) simultaneously. A thin and dotted line
shows the step input of the grip movement. A thick and dotted line shows the relative horizontal
distance between the grips and the position of the subject's body. The late response of the body
movement was found in the short period at starting. Thin lines show falling pushing force for the
increasing of the relative distance. The pushing force starts to fall at same time of increasing the
relative distance and then rises oppositely. Then, the pushing force almost returned to initial force. We
estimated the parameters, Tl=0.01, T2=0.3672 and KL=-0.0957.
Validation of the model
Figure 6 shows the validating result of the model in a period from starting to driving steadly. We
compare between the model and experments under the same wheelchair's conditions that the mass is
100kg and the driving resistance identified by experiments on flat linoleum is
/
r(Vc) = 10.2exp(-l.84ic) + 1.38Fc + 8.74 The subject exerted large force until the wheelchair speed reached
about 3km/h. Then attendant drove it at about constant speed. Two leg motion of walking provide
some periodic changes only on the pushing force. But there is no periodic change on the wheelchair
speed, so that the wheelchair mass was very large. The simulation result in the upper graph of the
Figure 6 almost corresponded to the experimental result despite with some differences. The lower
graph of the Figure 6 shows calculated result of relative speed and distance between the attendant and
the wheelchair. The relative speed and distance increased with starting wheelchair. After that, the
attendants began to follow the wheelchair, so the relative speed shows minus value and relative
distance began to decrease. Finally, Both the relative speed and distance was adjusted to zero gradually.
DISCUSSION
We found that F-Vh characteristic showing the Figure 3 has performance curve like other motor's one.