
Page 213 - Membranes for Industrial Wastewater Recovery and Re-Use
P. 213
a
___ ______
tttn it1 .II I I R~wHni.~
pc,.,,~,,,r,.(rcic) 1Rfl.5 136.1 151.7
USnotiC Prv5wre(PS11:) 5.5 2Ll.l 9.9
NDP(Mras)- 146.R PSlG
Rueraqe Perneate flux- 14.6 GFD, Permeate flow- 400.85 GPH
Recouery Permeate Feed Feed feed
array C1.m. (PerWFeed) GPD MC/L GPR N6/L PRESS(PS1G)
1 1 .EM 5511 2 39.9 452 175.5
2 .iu3 5335 z 36.1 590 118.1
3 -111 5190 2 37.4 557 166.6
4 .122 5062 2 28.8 626 163.2
5 .136 49b5 3 25.3 713 160.5
6 .153 4833 3 71.9 824 158.3
Fe4W &I D meRl a'tm Re&
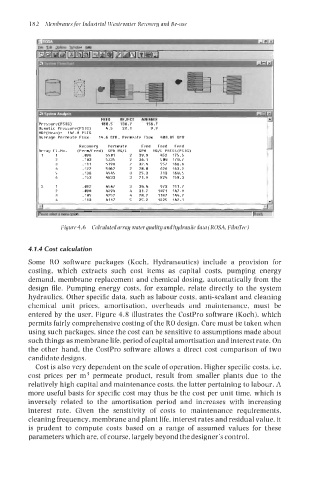
Figure 4.6 Cnlculatcdarray water quality and hydraulicdata (ROSA, FilrnTrc)
4.1.4 Cost calculation
Some RO software packages (Koch, Hydranautics) include a provision for
costing, which extracts such cost items as capital costs, pumping energy
demand, membrane replacement and chemical dosing, automatically from the
design file. Pumping energy costs, for example, relate directly to the system
hydraulics. Other specific data, such as labour costs, anti-scalant and cleaning
chemical unit prices, amortisation, overheads and maintenance, must be
entered by the user. Figure 4.8 illustrates the CostPro software (Koch), which
permits fairly comprehensive costing of the RO design. Care must be taken when
using such packages, since the cost can be sensitive to assumptions made about
such things as membrane life, period of capital amortisation and interest rate. On
the other hand, the CostPro software allows a direct cost comparison of two
candidate designs.
Cost is also very dependent on the scale of operation. Higher specific costs, i.e.
cost prices per m3 permeate product, result from smaller plants due to the
relatively high capital and maintenance costs, the latter pertaining to labour. A
more useful basis for specific cost may thus be the cost per unit time, which is
inversely related to the amortisation period and increases with increasing
interest rate. Given the sensitivity of costs to maintenance requirements,
cleaning frequency, membrane and plant life, interest rates and residual value, it
is prudent to compute costs based on a range of assumed values for these
parameters which are, of course, largely beyond the designer's control.