
Page 290 - Methods For Monitoring And Diagnosing The Efficiency Of Catalytic Converters A Patent - oriented Survey
P. 290
272 Methods for Monitoring and Diagnosing the Eficiency of Catalytic Converters
where
(7; - T,) is the temperature difference between the temperature of the heated air mass
before entering the converter and the temperature of the heated air mass after exiting the
converter and
C,,.,, is a constant representative of the specific heat of the air
I1
of
3) determining an initial temperature - the catalyst material by using the equation:
Dt
where
A is the total surface area of the exhaust pipe and catalyst material between the upstream
and the downstream sensor,
C, is a constant representative of the heat transfer from the heated air mass to the catalyst
material and
a equals to 0.5 or 0.9 for laminar or turbulent flow respectively.
Step 3 is repeated twice in a time step At to calculate two values of the catalyst temperature
7L0, and to form the initial rate of temperature of the catalyst
4) forming a first ratio from the initial heat transfer rate and the initial rate of change of
temperature
5) determining a subsequent heat transfer rate from the heated air mass to the catalyst material
6) determining a subsequent rate of change of temperature of the catalytic converter
7) forming a second ratio from the subsequent heat transfer rate and the subsequent rate of
change of temperature
8) comparing the second ratio to the first ratio to track a trend of these ratios
9) repeating steps 1 through 8 until the trend of these ratios exhibits a predetermined downturn
IO) determining the time required for the catalytic converter to light-off during a cold start-up
to be the time from the air propelling step 1 to the time required for the downturn of step 9
11) comparing this time to a threshold value and
12) determining that the catalytic converter is defected if this time exceeds the threshold value
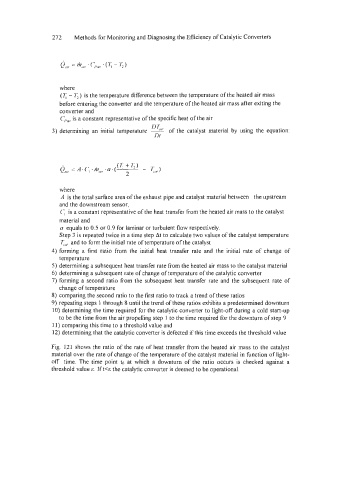
Fig. 121 shows the ratio of the rate of heat transfer from the heated air mass to the catalyst
material over the rate of change of the temperature of the catalyst material in knction of light-
off time. The time point to at which a downturn of the ratio occurs is checked against a
threshold value E. If t<E the catalytic converter is deemed to be operational.