
Page 76 - Methods For Monitoring And Diagnosing The Efficiency Of Catalytic Converters A Patent - oriented Survey
P. 76
58 Methods for Monitoring and Diagnosing the Efficiency of Catalytic Converters
b) the per time unit oxygen surplus or shortage of exhaust gas oxygen flowing into the
converter is higher than a predetermined maximum value
5) determining that the catalytic converter is deteriorated when the calculated sum (or integral)
of differences of step 3 during said time period is higher than a predetermined threshold
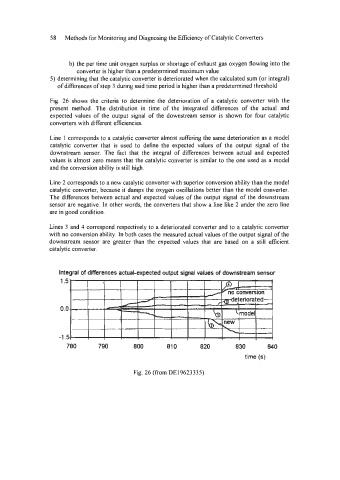
Fig. 26 shows the criteria to determine the deterioration of a catalytic converter with the
present method. The distribution in time of the integrated differences of the actual and
expected values of the output signal of the downstream sensor is shown for four catalytic
converters with different efficiencies.
Line 1 corresponds to a catalytic converter almost suffering the same deterioration as a model
catalytic converter that is used to define the expected values of the output signal of the
downstream sensor. The fact that the integral of differences between actual and expected
values is almost zero means that the catalytic converter is similar to the one used as a model
and the conversion ability is still high.
Line 2 corresponds to a new catalytic converter with superior conversion ability than the model
catalytic converter, because it damps the oxygen oscillations better than the model converter.
The differences between actual and expected values of the output signal of the downstream
sensor are negative. In other words, the converters that show a line like 2 under the zero line
are in good condition.
Lines 3 and 4 correspond respectively to a deteriorated converter and to a catalytic converter
with no conversion ability. In both cases the measured actual values of the output signal of the
downstream sensor are greater than the expected values that are based on a still efficient
catalytic converter.
Integral of differences actual-expected output signal values of downstream sensor
1.5
0.0
I 1 I I \I I i
. .-,
-1 Ei I I I 1 1 I 1 1 1-7
780 790 800 81 0 820 830 840
time (s)
Fig. 26 (from DE19623335)