
Page 73 - Methods For Monitoring And Diagnosing The Efficiency Of Catalytic Converters A Patent - oriented Survey
P. 73
Robert Bosch GmbH. 55
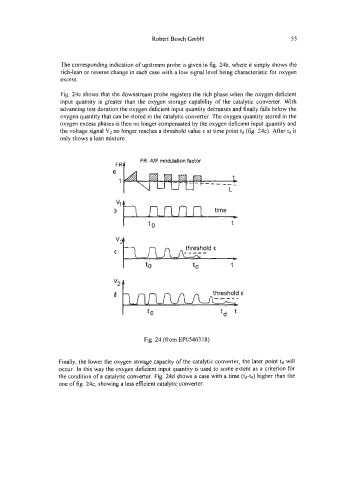
The corresponding indication of upstream probe is given in fig. 24b, where it simply shows the
rich-lean or reverse change in each case with a low signal level being characteristic for oxygen
excess.
Fig. 24c shows that the downstream probe registers the rich phase when the oxygen deficient
input quantity is greater than the oxygen storage capability of the catalytic converter. With
advancing test duration the oxygen deficient input quantity decreases and finally falls below the
oxygen quantity that can be stored in the catalytic converter. The oxygen quantity stored in the
oxygen excess phases is then no longer compensated by the oxygen deficient input quantity and
the voltage signal Vz no longer reaches a threshold value E at time point td (fig. 24c). After fd it
only shows a lean mixture.
FR: NF modulation factor
FR+
a
1
V4 A
I
b
I t0 t
I t0
Fig. 24 (from EP05463 18)
Finally, the lower the oxygen storage capacity of the catalytic converter, the later point t,~ will
occur. In this way the oxygen deficient input quantity is used to some extent as a criterion for
the condition of a catalytic converter. Fig. 24d shows a case with a time (fd-fo) higher than the
one of fig. 24c, showing a less efficient catalytic converter.