Page 228 -
P. 228

6 Answers, Hints and Solutions  219
                            A3.6 See Fig. A.4.


                                                                      1.2

                                                                      1.0
                                                                      0.8
                                                                      0.6

                                                                      0.4
                                                                         RADIUS
                                                     E´
                                                                      0.2
                                                                      E
                                                                      0    Y
                                                                      0.2 Z
                                                                      0.4

                                                                      0.6
                                                                      0.8
                                                                      1.0

                                                                      1.2
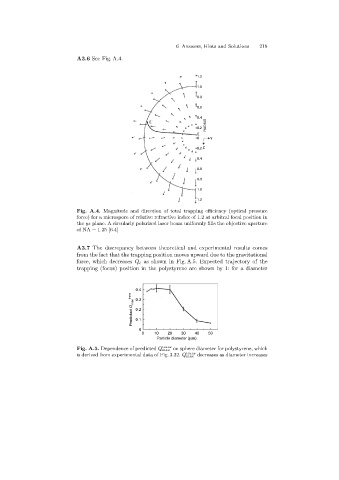
                            Fig. A.4. Magnitude and direction of total trapping efficiency (optical pressure
                            force)for a microspore of relative refractive index of 1.2 at arbitral focal position in
                            the yz plane. A circularly polarized laser beam uniformly fills the objective aperture
                            of NA = 1.25 [6.4]


                            A3.7 The discrepancy between theoretical and experimental results comes
                            from the fact that the trappingposition moves upward due to the gravitational
                            force, which decreases Q t as shown in Fig. A.5. Expected trajectory of the
                            trapping(focus) position in the polystyrene are shown by 1: for a diameter


                                                 0.4
                                               trans  0.3
                                               Predicted Q max  0.2


                                                 0.1
                                                  0
                                                   0   10   20   30  40   50
                                                        Particle diameter (mm)
                                                          trans
                            Fig. A.5. Dependence of predicted Q max on sphere diameter for polystyrene, which
                                                                  trans
                            is derived from experimental data of Fig. 3.32. Q max decreases as diameter increases
   223   224   225   226   227   228   229   230   231   232   233