Page 222 - A Practical Guide from Design Planning to Manufacturing
P. 222

Logic Design  195


                                             PS 1 PS 0
                                          00  01  11  10
                                        0  0  0  1   0
                                    Tk
                                        1  0  1  1   1
         PS 1 PS 0  Tk  NS 1  NS 0 Prd  NS =  PS PS + PS Tk + PS Tk
                                         1
                                                       0
                                    1
                                            0
                                                 1
          0  0  0   0   0  0
          0  0  1   0   1  0
                                             PS 1 PS 0
          0  1  0   0   0  0              00  01  11  10
          0  1  1   1   0  0            0  0  0  0   1
                                    Tk
          1  0  0   0   1  1            1  1  0  1   1
          1  0  1   1   1  1      NS =  PS PS + PS Tk + PS Tk
                                         1
                                                       0
                                                 1
                                            0
                                    0
          1  1  0   1   0  1
          1  1  1   1   1  1                 PS PS 0
                                                1
                                          00  01  11  10
                                        0  0  0  1   1
                                    Tk
                                        1  0  0  1   1
                                            Prd = PS 1
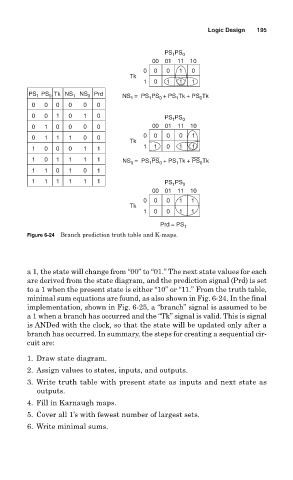
        Figure 6-24 Branch prediction truth table and K-maps.

        a 1, the state will change from “00” to “01.” The next state values for each
        are derived from the state diagram, and the prediction signal (Prd) is set
        to a 1 when the present state is either “10” or “11.” From the truth table,
        minimal sum equations are found, as also shown in Fig. 6-24. In the final
        implementation, shown in Fig. 6-25, a “branch” signal is assumed to be
        a 1 when a branch has occurred and the “Tk” signal is valid. This is signal
        is ANDed with the clock, so that the state will be updated only after a
        branch has occurred. In summary, the steps for creating a sequential cir-
        cuit are:
        1. Draw state diagram.
        2. Assign values to states, inputs, and outputs.
        3. Write truth table with present state as inputs and next state as
           outputs.
        4. Fill in Karnaugh maps.
        5. Cover all 1’s with fewest number of largest sets.
        6. Write minimal sums.
   217   218   219   220   221   222   223   224   225   226   227