
Page 262 - A Practical Guide from Design Planning to Manufacturing
P. 262
234 Chapter Seven
As transistor dimensions are reduced, the total transistor width will
be reduced, but adding new transistors will increase total width and
leakage. Transistors that are switched off and in series with other off
transistors will have dramatically reduced leakage. This reduction in
leakage can be modeled by a stacking factor parameter of less than 1.
The largest factor in determining leakage is the leakage per transistor
width of the fabrication technology. As transistors have been reduced in
size, their leakage currents have increased dramatically. Scaling of proces-
sor supply voltages has required reductions in transistor threshold volt-
ages in order to maintain performance, but this dramatically increases
subthreshold leakage.
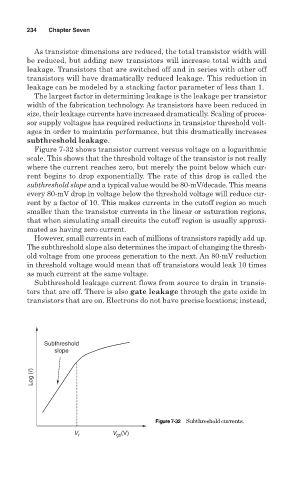
Figure 7-32 shows transistor current versus voltage on a logarithmic
scale. This shows that the threshold voltage of the transistor is not really
where the current reaches zero, but merely the point below which cur-
rent begins to drop exponentially. The rate of this drop is called the
subthreshold slope and a typical value would be 80-mV/decade. This means
every 80-mV drop in voltage below the threshold voltage will reduce cur-
rent by a factor of 10. This makes currents in the cutoff region so much
smaller than the transistor currents in the linear or saturation regions,
that when simulating small circuits the cutoff region is usually approxi-
mated as having zero current.
However, small currents in each of millions of transistors rapidly add up.
The subthreshold slope also determines the impact of changing the thresh-
old voltage from one process generation to the next. An 80-mV reduction
in threshold voltage would mean that off transistors would leak 10 times
as much current at the same voltage.
Subthreshold leakage current flows from source to drain in transis-
tors that are off. There is also gate leakage through the gate oxide in
transistors that are on. Electrons do not have precise locations; instead,
Subthreshold
slope
Log (I)
Figure 7-32 Subthreshold currents.
V t V (V)
gs