
Page 245 - Microtectonics
P. 245
7.8 · Reaction Rims 235
Box 7.5 Continued
Fig. B.7.1. a Diagram showing three evolutionary stages of a subduction complex at an active continental margin, culminating in
▼
terrane collision. Five sample locations α to ε, are indicated. They are progressively involved in successive deformation phases and
metamorphism. γ represents a mafic intrusion. b Diagram showing relationships between porphyroblast growth (dark grey, miner-
als A–G) and deformation (light grey, deformation phases D –D ) in time and space for the region illustrated in a. The sequence of
1
4
events starts with sedimentation (bold line at left), followed by diagenetic compaction (medium grey). Deformation phases are
continuous in space, except along major fault zones such as at terrane boundaries; they can be diachronous and even joining in
space (e.g. D and D ). D at α represents early deformation related to the genesis of this terrane; D at β to ε reflects the subduc-
2
1
1
1
tion movement and is therefore strongly diachronous; D 2 at δ and ε represents ductile obduction or backthrusting related to the
shape of the continental margin. The arrival of the terrane causes renewed deformation, propagating outwards from the collision
area, labelled D at sites α to γ, and D at δ and ε. Finally, D at α to γ and D at δ and ε reflect orogenic collapse and associated
4
3
3
2
uplift. Metamorphic evolution is presented in a simplified way as growth of single minerals rather than mineral associations. Such
growth can also be diachronous, but can be discontinuous both at major faults and at lithologic contacts. A is a high T/low P min-
eral related to arc activity, whereas B is a high P/low T mineral related to subduction. C may be a medium P/T mineral and D is a
retrograde mineral. Minerals E, F and G reflect a similar history in the mafic intrusion, with somewhat different growth periods.
c Shows the sequence of events at site ε as an example of the terminology used, and shows how structural and metamorphic analy-
sis of individual samples can help to unravel the tectonic evolution of a region
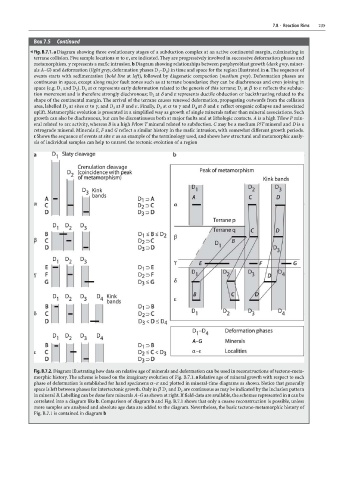
Fig. B.7.2. Diagram illustrating how data on relative age of minerals and deformation can be used in reconstructions of tectono-meta-
morphic history. The scheme is based on the imaginary evolution of Fig. B.7.1. a Relative age of mineral growth with respect to each
phase of deformation is established for hand specimens α–ε and plotted in mineral-time diagrams as shown. Notice that generally
space is left between phases for intertectonic growth. Only in β D and D are continuous as may be indicated by the inclusion pattern
2
1
in mineral B. Labelling can be done fore minerals A–G as shown at right. If field-data are available, the schemes represented in a can be
correlated into a diagram like b. Comparison of diagram b and Fig. B.7.1 shows that only a coarse reconstruction is possible, unless
more samples are analysed and absolute age data are added to the diagram. Nevertheless, the basic tectono-metamorphic history of
Fig. B.7.1 is contained in diagram b