
Page 258 - Microtectonics
P. 258
250 9 · Natural Microgauges
(Groshong 1972, 1974; Groshong et al. 1984a,b; Wiltschko ing (s), or a transition from extension to shortening (e–s)
et al. 1985; Kilsdonk and Wiltschko 1988; Ferrill and Gro- and vice versa (s–e) (Figs. 2.8, 5.39). Finite strain affects
shong 1993; Evans and Groshong 1994; Harris and van the shape of the patterns, but not the relative size ratio
der Pluijm 1998; González-Casado and García-Cuevas of the (e–s) and (s–e) fields. If the relative size ratio can
1999, 2002; Craddock et al. 2000; González-Casado et al. be established in a rock, they are a measure of W and A k
k
2003). Thin sections have to be prepared carefully in or- (Passchier 1991a) Veins which become folded or boudi-
der to avoid twinning and fracturing during sample prepa- naged can be used for such an analysis provided that a
ration. About 50 grains are usually sufficient to determine large range of orientations is present (Fig. 5.39). The
strain, but the method only works for coaxial progressive method has been applied to rocks by Passchier (1986b),
deformation (Evans and Groshong 1994; Burkhard 1993) Passchier and Urai (1988) and Wallis (1992a).
and may be more suitable to find strain orientation than A problem of the vein-set method is that boundaries
strain magnitude (González-Casado et al. 2003). There is between material line fields (Fig. 5.39) will not coincide
also a linear relationship between the ratio of twinned to with boundaries between fields of folded and boudinaged
untwinned crystal as can be measured on a U-stage, and veins, and a calibration is necessary which is, at present,
finite shear strain in a sample. This relationship is inde- difficult. The method will only work for deformation his-
pendent of temperature (Ferrill et al. 2004). Plots of mean tories with flow conditions that remained constant or
twin intensity to mean twin width contain information underwent little change. The method is therefore at best
on finite strain and temperature of deformation (Ferrill semi-quantitative and has been mainly used to determine
et al. 2004; Sect. 9.9). However, twinning only records the sense of shear (Fig. 5.39).
crystal-plastic component of the deformation, and brittle
fracturing and pressure solution may also contribute con- 9.3.3
siderably (Groshong et al. 1984a; Ferrill and Groshong 1993). Lattice-Preferred Orientation
Twinning is also used to determine the orientation and mag-
nitude of stress during deformation (Sects. 9.5.1, 9.6.3). The geometry of LPO patterns such as those for quartz
and calcite is a function of finite strain, strain geometry,
9.3 9.3 active slip systems and W (Sect. 4.4.2). LPO patterns
k
Vorticity Gauges can therefore be used to distinguish between coaxial and
non-coaxial progressive deformation (Law et al. 1986;
9.3.1 Law 1987), and to determine W (Lister and Williams
k
Introduction 1979; Wenk et al. 1987; Ratschbacher et al. 1991; Erskine
et al. 1993; Xypolias and Koukouvelas 2001). However,
Several methods have been proposed to establish the kin- measurements of W by this type of analysis tend to be
k
ematic vorticity number W of flow in rocks, i.e. the ratio rather inaccurate because they are slow to respond to
k
of pure shear to simple shear (Sect. 2.5.2; Passchier 1988a; changes in kinematics (Bestmann et al. 2000). Platt and
Means 1994). A useful tool in such reconstruction is the Behrmann (1986) and Wallis (1992a) combined high
Mohr diagram for stretch (Means 1982; Passchier 1988b, quality strain data with degree of quartz LPO pattern
1990b). All applied methods are still in the phase of de- asymmetry to find W ; Vissers (1989) combined the ro-
k
velopment and several microstuctures such as asymmet- tation angle of garnet porphyroblasts with garnet aspect
ric boudins (Passchier and Druguet 2002), flanking struc-
tures (Passchier 2001; Graseman et al. 2003) and crystal
tiling (Mulchrone et al. 2005) could be developed as new
tools. In many cases, W of flow may change during pro-
k
gressive deformation, and therefore most methods deter-
mine a mean value of W over time, named W (Sect. 9.3.9;
k m
Passchier 1988a). A short outline of the presently applied
methods to determine W or W in rocks is given below.
k m
9.3.2
Deformed Sets of Veins
The stretch history of a particular material line in ho-
mogenous flow depends not only on its initial orienta-
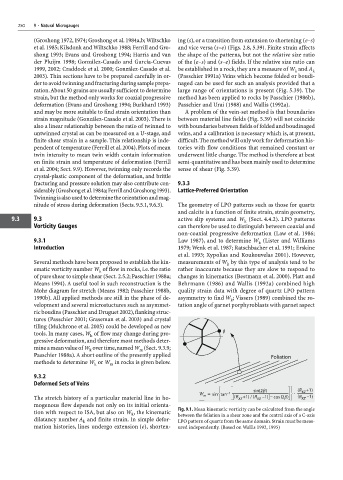
tion with respect to ISA, but also on W , the kinematic Fig. 9.1. Mean kinematic vorticity can be calculated from the angle
k
between the foliation in a shear zone and the central axis of a C-axis
dilatancy number A and finite strain. In simple defor-
k LPO pattern of quartz from the same domain. Strain must be meas-
mation histories, lines undergo extension (e), shorten- ured independently. (Based on Wallis 1992, 1995)