
Page 218 - MODELING OF ASPHALT CONCRETE
P. 218
196 Cha pte r Se v e n
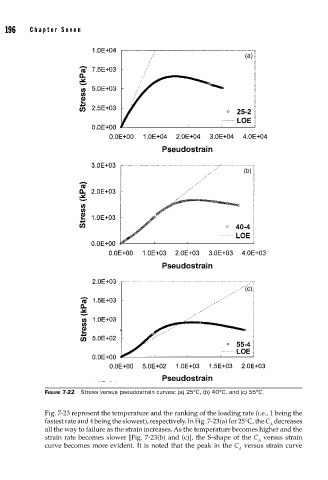
FIGURE 7-22 Stress versus pseudostrain curves: (a) 25°C, (b) 40°C, and (c) 55°C.
Fig. 7-23 represent the temperature and the ranking of the loading rate (i.e., 1 being the
fastest rate and 4 being the slowest), respectively. In Fig. 7-23(a) for 25°C, the C decreases
A
all the way to failure as the strain increases. As the temperature becomes higher and the
strain rate becomes slower [Fig. 7-23(b) and (c)], the S-shape of the C versus strain
A
curve becomes more evident. It is noted that the peak in the C versus strain curve
A