
Page 213 - MODELING OF ASPHALT CONCRETE
P. 213
VEPCD Modeling of Asphalt Concr ete with Gr owing Damage 191
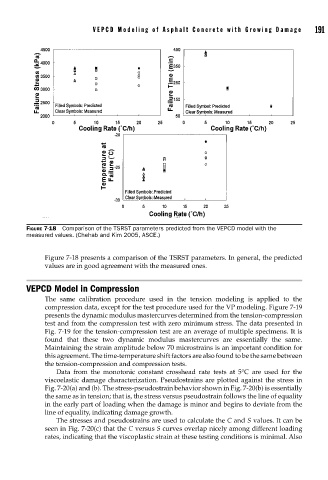
FIGURE 7-18 Comparison of the TSRST parameters predicted from the VEPCD model with the
measured values. (Chehab and Kim 2005, ASCE.)
Figure 7-18 presents a comparison of the TSRST parameters. In general, the predicted
values are in good agreement with the measured ones.
VEPCD Model in Compression
The same calibration procedure used in the tension modeling is applied to the
compression data, except for the test procedure used for the VP modeling. Figure 7-19
presents the dynamic modulus mastercurves determined from the tension-compression
test and from the compression test with zero minimum stress. The data presented in
Fig. 7-19 for the tension-compression test are an average of multiple specimens. It is
found that these two dynamic modulus mastercurves are essentially the same.
Maintaining the strain amplitude below 70 microstrains is an important condition for
this agreement. The time-temperature shift factors are also found to be the same between
the tension-compression and compression tests.
Data from the monotonic constant crosshead rate tests at 5°C are used for the
viscoelastic damage characterization. Pseudostrains are plotted against the stress in
Fig. 7-20(a) and (b). The stress-pseudostrain behavior shown in Fig. 7-20(b) is essentially
the same as in tension; that is, the stress versus pseudostrain follows the line of equality
in the early part of loading when the damage is minor and begins to deviate from the
line of equality, indicating damage growth.
The stresses and pseudostrains are used to calculate the C and S values. It can be
seen in Fig. 7-20(c) that the C versus S curves overlap nicely among different loading
rates, indicating that the viscoplastic strain at these testing conditions is minimal. Also