
Page 212 - MODELING OF ASPHALT CONCRETE
P. 212
190 Cha pte r Se v e n
of the viscoplastic model may be even greater than the research presented in this chapter
may suggest.
Prediction of Fracture Point
As the specimen is cooled, the thermal stress increases until it equals the tensile strength
of the asphalt mix, ultimately leading to the fracture of the specimen. While mechanistic
material characterization models allow the prediction of the thermal stress history,
alone they cannot be used to determine the instance of failure. Most of the models that
have been developed to predict the fracture point using the TSRST data utilize strength
as a failure criterion (Jung and Vinson 1994, SHRP-A-357 1993).
In this study, the effect of temperature and loading rate on the strength is reflected
through the reduced strain rate, that is, the product of the strain rate and the time-
temperature shift factor. The strain, in this sense, would not be the measured strain
because it is zero. As explained in the previous sections, it is the thermal strain that would
have resulted at that instance, had the specimen not been restrained. The strength versus
reduced strain rate relationships for different asphalt mixtures are shown in Fig. 7-13.
In developing the VECD and VEPCD models, monotonic tests were conducted at
−5
several temperatures and strain rates (−10°C to 40°C; 10 e/s to 0.1 e/s). The LVE time-
temperature shift factors were used to convert the strain rate to the reduced strain rate
at a reference temperature (25°C in this study), using Eq. (7-2). The peak stress (fracture
stress for brittle failures) for each monotonic test is plotted against the corresponding
reduced strain rate of that test to construct the strength failure envelope for the mix.
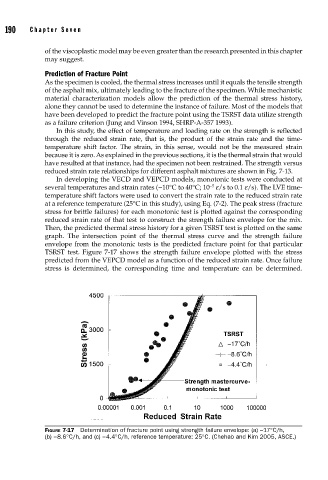
Then, the predicted thermal stress history for a given TSRST test is plotted on the same
graph. The intersection point of the thermal stress curve and the strength failure
envelope from the monotonic tests is the predicted fracture point for that particular
TSRST test. Figure 7-17 shows the strength failure envelope plotted with the stress
predicted from the VEPCD model as a function of the reduced strain rate. Once failure
stress is determined, the corresponding time and temperature can be determined.
FIGURE 7-17 Determination of fracture point using strength failure envelope: (a) −17°C/h,
(b) −8.6°C/h, and (c) −4.4°C/h, reference temperature: 25°C. (Chehab and Kim 2005, ASCE.)