
Page 211 - MODELING OF ASPHALT CONCRETE
P. 211
VEPCD Modeling of Asphalt Concr ete with Gr owing Damage 189
Prediction of Thermal Stress History
For notational brevity, the thermal stress and strain are identified by s and e, respectively.
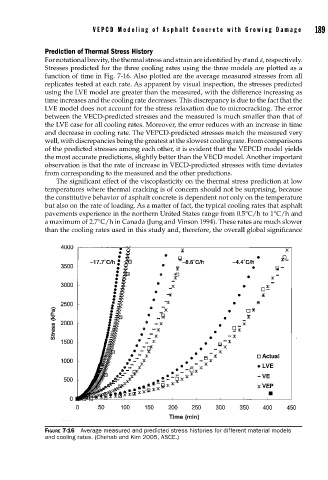
Stresses predicted for the three cooling rates using the three models are plotted as a
function of time in Fig. 7-16. Also plotted are the average measured stresses from all
replicates tested at each rate. As apparent by visual inspection, the stresses predicted
using the LVE model are greater than the measured, with the difference increasing as
time increases and the cooling rate decreases. This discrepancy is due to the fact that the
LVE model does not account for the stress relaxation due to microcracking. The error
between the VECD-predicted stresses and the measured is much smaller than that of
the LVE case for all cooling rates. Moreover, the error reduces with an increase in time
and decrease in cooling rate. The VEPCD-predicted stresses match the measured very
well, with discrepancies being the greatest at the slowest cooling rate. From comparisons
of the predicted stresses among each other, it is evident that the VEPCD model yields
the most accurate predictions, slightly better than the VECD model. Another important
observation is that the rate of increase in VECD-predicted stresses with time deviates
from corresponding to the measured and the other predictions.
The significant effect of the viscoplasticity on the thermal stress prediction at low
temperatures where thermal cracking is of concern should not be surprising, because
the constitutive behavior of asphalt concrete is dependent not only on the temperature
but also on the rate of loading. As a matter of fact, the typical cooling rates that asphalt
pavements experience in the northern United States range from 0.5°C/h to 1°C/h and
a maximum of 2.7°C/h in Canada (Jung and Vinson 1994). These rates are much slower
than the cooling rates used in this study and, therefore, the overall global significance
FIGURE 7-16 Average measured and predicted stress histories for different material models
and cooling rates. (Chehab and Kim 2005, ASCE.)