
Page 214 - MODELING OF ASPHALT CONCRETE
P. 214
192 Cha pte r Se v e n
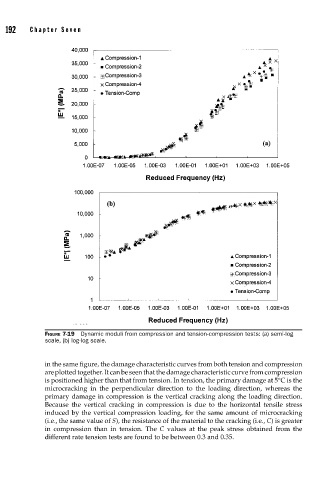
FIGURE 7-19 Dynamic moduli from compression and tension-compression tests: (a) semi-log
scale, (b) log-log scale.
in the same figure, the damage characteristic curves from both tension and compression
are plotted together. It can be seen that the damage characteristic curve from compression
is positioned higher than that from tension. In tension, the primary damage at 5°C is the
microcracking in the perpendicular direction to the loading direction, whereas the
primary damage in compression is the vertical cracking along the loading direction.
Because the vertical cracking in compression is due to the horizontal tensile stress
induced by the vertical compression loading, for the same amount of microcracking
(i.e., the same value of S), the resistance of the material to the cracking (i.e., C) is greater
in compression than in tension. The C values at the peak stress obtained from the
different rate tension tests are found to be between 0.3 and 0.35.