
Page 210 - MODELING OF ASPHALT CONCRETE
P. 210
188 Cha pte r Se v e n
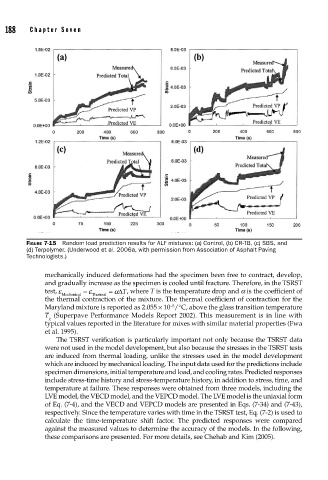
FIGURE 7-15 Random load prediction results for ALF mixtures: (a) Control, (b) CR-TB, (c) SBS, and
(d) Terpolymer. (Underwood et al. 2006a, with permission from Association of Asphalt Paving
Technologists.)
mechanically induced deformations had the specimen been free to contract, develop,
and gradually increase as the specimen is cooled until fracture. Therefore, in the TSRST
test, ε − ε = αΔT, where T is the temperature drop and a is the coefficient of
Mechanical Thermal
the thermal contraction of the mixture. The thermal coefficient of contraction for the
−5
Maryland mixture is reported as 2.055 × 10 /°C, above the glass transition temperature
T (Superpave Performance Models Report 2002). This measurement is in line with
g
typical values reported in the literature for mixes with similar material properties (Fwa
et al. 1995).
The TSRST verification is particularly important not only because the TSRST data
were not used in the model development, but also because the stresses in the TSRST tests
are induced from thermal loading, unlike the stresses used in the model development
which are induced by mechanical loading. The input data used for the predictions include
specimen dimensions, initial temperature and load, and cooling rates. Predicted responses
include stress-time history and stress-temperature history, in addition to stress, time, and
temperature at failure. These responses were obtained from three models, including the
LVE model, the VECD model, and the VEPCD model. The LVE model is the uniaxial form
of Eq. (7-4), and the VECD and VEPCD models are presented in Eqs. (7-34) and (7-43),
respectively. Since the temperature varies with time in the TSRST test, Eq. (7-2) is used to
calculate the time-temperature shift factor. The predicted responses were compared
against the measured values to determine the accuracy of the models. In the following,
these comparisons are presented. For more details, see Chehab and Kim (2005).