
Page 209 - MODELING OF ASPHALT CONCRETE
P. 209
VEPCD Modeling of Asphalt Concr ete with Gr owing Damage 187
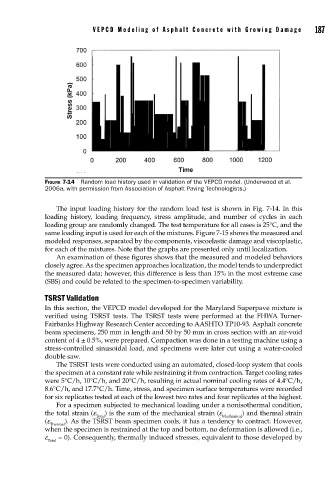
FIGURE 7-14 Random load history used in validation of the VEPCD model. (Underwood et al.
2006a, with permission from Association of Asphalt Paving Technologists.)
The input loading history for the random load test is shown in Fig. 7-14. In this
loading history, loading frequency, stress amplitude, and number of cycles in each
loading group are randomly changed. The test temperature for all cases is 25°C, and the
same loading input is used for each of the mixtures. Figure 7-15 shows the measured and
modeled responses, separated by the components, viscoelastic damage and viscoplastic,
for each of the mixtures. Note that the graphs are presented only until localization.
An examination of these figures shows that the measured and modeled behaviors
closely agree. As the specimen approaches localization, the model tends to underpredict
the measured data; however, this difference is less than 15% in the most extreme case
(SBS) and could be related to the specimen-to-specimen variability.
TSRST Validation
In this section, the VEPCD model developed for the Maryland Superpave mixture is
verified using TSRST tests. The TSRST tests were performed at the FHWA Turner-
Fairbanks Highway Research Center according to AASHTO TP10-93. Asphalt concrete
beam specimens, 250 mm in length and 50 by 50 mm in cross section with an air-void
content of 4 ± 0.5%, were prepared. Compaction was done in a testing machine using a
stress-controlled sinusoidal load, and specimens were later cut using a water-cooled
double saw.
The TSRST tests were conducted using an automated, closed-loop system that cools
the specimen at a constant rate while restraining it from contraction. Target cooling rates
were 5°C/h, 10°C/h, and 20°C/h, resulting in actual nominal cooling rates of 4.4°C/h,
8.6°C/h, and 17.7°C/h. Time, stress, and specimen surface temperatures were recorded
for six replicates tested at each of the lowest two rates and four replicates at the highest.
For a specimen subjected to mechanical loading under a nonisothermal condition,
the total strain (e ) is the sum of the mechanical strain (e ) and thermal strain
Total Mechanical
(e ). As the TSRST beam specimen cools, it has a tendency to contract. However,
Thermal
when the specimen is restrained at the top and bottom, no deformation is allowed (i.e.,
e = 0). Consequently, thermally induced stresses, equivalent to those developed by
Total