
Page 205 - MODELING OF ASPHALT CONCRETE
P. 205
VEPCD Modeling of Asphalt Concr ete with Gr owing Damage 183
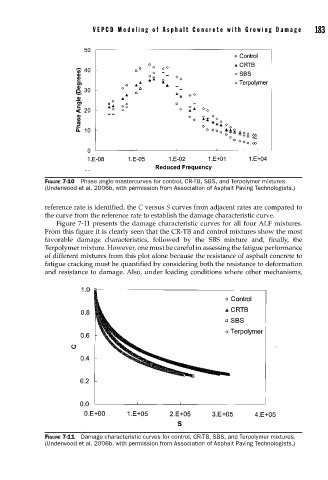
FIGURE 7-10 Phase angle mastercurves for control, CR-TB, SBS, and Terpolymer mixtures.
(Underwood et al. 2006b, with permission from Association of Asphalt Paving Technologists.)
reference rate is identified, the C versus S curves from adjacent rates are compared to
the curve from the reference rate to establish the damage characteristic curve.
Figure 7-11 presents the damage characteristic curves for all four ALF mixtures.
From this figure it is clearly seen that the CR-TB and control mixtures show the most
favorable damage characteristics, followed by the SBS mixture and, finally, the
Terpolymer mixture. However, one must be careful in assessing the fatigue performance
of different mixtures from this plot alone because the resistance of asphalt concrete to
fatigue cracking must be quantified by considering both the resistance to deformation
and resistance to damage. Also, under loading conditions where other mechanisms,
FIGURE 7-11 Damage characteristic curves for control, CR-TB, SBS, and Terpolymer mixtures.
(Underwood et al. 2006b, with permission from Association of Asphalt Paving Technologists.)