
Page 200 - MODELING OF ASPHALT CONCRETE
P. 200
178 Cha pte r Se v e n
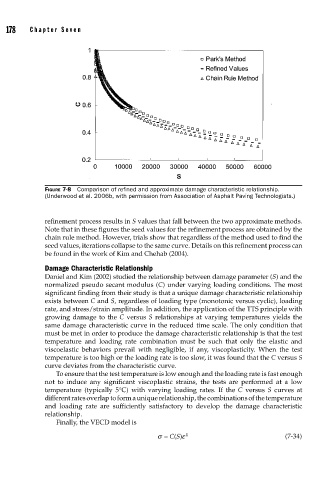
FIGURE 7-8 Comparison of refi ned and approximate damage characteristic relationship.
(Underwood et al. 2006b, with permission from Association of Asphalt Paving Technologists.)
refinement process results in S values that fall between the two approximate methods.
Note that in these figures the seed values for the refinement process are obtained by the
chain rule method. However, trials show that regardless of the method used to find the
seed values, iterations collapse to the same curve. Details on this refinement process can
be found in the work of Kim and Chehab (2004).
Damage Characteristic Relationship
Daniel and Kim (2002) studied the relationship between damage parameter (S) and the
normalized pseudo secant modulus (C) under varying loading conditions. The most
significant finding from their study is that a unique damage characteristic relationship
exists between C and S, regardless of loading type (monotonic versus cyclic), loading
rate, and stress/strain amplitude. In addition, the application of the TTS principle with
growing damage to the C versus S relationships at varying temperatures yields the
same damage characteristic curve in the reduced time scale. The only condition that
must be met in order to produce the damage characteristic relationship is that the test
temperature and loading rate combination must be such that only the elastic and
viscoelastic behaviors prevail with negligible, if any, viscoplasticity. When the test
temperature is too high or the loading rate is too slow, it was found that the C versus S
curve deviates from the characteristic curve.
To ensure that the test temperature is low enough and the loading rate is fast enough
not to induce any significant viscoplastic strains, the tests are performed at a low
temperature (typically 5°C) with varying loading rates. If the C versus S curves at
different rates overlap to form a unique relationship, the combinations of the temperature
and loading rate are sufficiently satisfactory to develop the damage characteristic
relationship.
Finally, the VECD model is
σ = CS() ε R (7-34)