
Page 72 - MODELING OF ASPHALT CONCRETE
P. 72
50 Cha pte r T w o
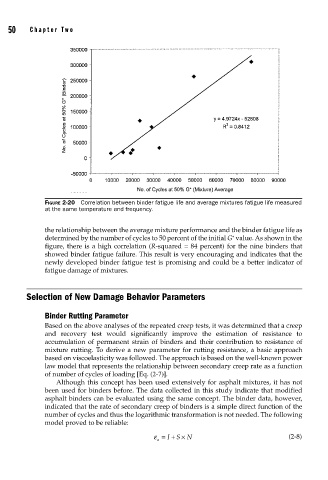
FIGURE 2-20 Correlation between binder fatigue life and average mixtures fatigue life measured
at the same temperature and frequency.
the relationship between the average mixture performance and the binder fatigue life as
∗
determined by the number of cycles to 50 percent of the initial G value. As shown in the
figure, there is a high correlation (R-squared = 84 percent) for the nine binders that
showed binder fatigue failure. This result is very encouraging and indicates that the
newly developed binder fatigue test is promising and could be a better indicator of
fatigue damage of mixtures.
Selection of New Damage Behavior Parameters
Binder Rutting Parameter
Based on the above analyses of the repeated creep tests, it was determined that a creep
and recovery test would significantly improve the estimation of resistance to
accumulation of permanent strain of binders and their contribution to resistance of
mixture rutting. To derive a new parameter for rutting resistance, a basic approach
based on viscoelasticity was followed. The approach is based on the well-known power
law model that represents the relationship between secondary creep rate as a function
of number of cycles of loading [Eq. (2-7)].
Although this concept has been used extensively for asphalt mixtures, it has not
been used for binders before. The data collected in this study indicate that modified
asphalt binders can be evaluated using the same concept. The binder data, however,
indicated that the rate of secondary creep of binders is a simple direct function of the
number of cycles and thus the logarithmic transformation is not needed. The following
model proved to be reliable:
×
ε =+ S N (2-8)
I
a