
Page 55 - Modeling of Chemical Kinetics and Reactor Design
P. 55
Reaction Mechanisms and Rate Expressions 25
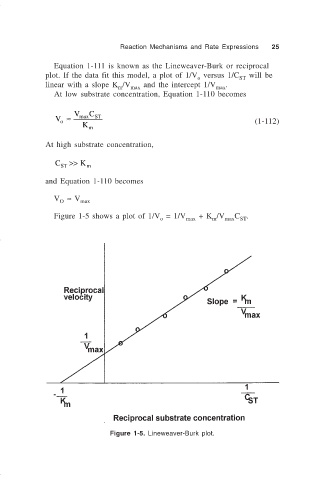
Equation 1-111 is known as the Lineweaver-Burk or reciprocal
plot. If the data fit this model, a plot of 1/V versus 1/C will be
o
ST
linear with a slope K /V max and the intercept 1/V max .
m
At low substrate concentration, Equation 1-110 becomes
V ≈ V max C ST (1-112)
o
K
m
At high substrate concentration,
C ST >> K m
and Equation 1-110 becomes
V ≈ V
O max
Figure 1-5 shows a plot of 1/V = 1/V + K /V C .
o max m max ST
Figure 1-5. Lineweaver-Burk plot.