
Page 328 - Modern Analytical Chemistry
P. 328
1400-CH09 9/9/99 2:13 PM Page 311
Chapter 9 Titrimetric Methods of Analysis 311
–
than that of A . Determining the pK a by the half-equivalence point method overes-
timates its value if the acid is too strong and underestimates its value if the acid is
too weak.
A second approach for determining the pK a of an acid is to replot the titration
curve in a linear form as a Gran plot. For example, earlier we learned that the titra-
tion of a weak acid with a strong base can be plotted in a linear form using the fol-
lowing equation
+
V b ´[H 3 O ]= K a ´V eq – K a ´V b
+
Plotting V b ´[H 3 O ] versus V b , for volumes less than the equivalence point volume
yields a straight line with a slope of –K a . Other linearizations have been developed
8
7
that use all the points on a titration curve or require no assumptions. This ap-
proach to determining acidity constants has been used to study the acid–base prop-
erties of humic acids, which are naturally occurring, large-molecular-weight organic
acids with multiple acidic sites. In one study, a sample of humic acid was found to
have six titratable sites, three of which were identified as carboxylic acids, two of
which were believed to be secondary or tertiary amines, and one of which was iden-
tified as a phenolic group. 9
9 B.8 Evaluation of Acid–Base Titrimetry 14.00 (a)
12.00 (b)
Scale of Operation In an acid–base titration the volume of titrant needed to (c)
10.00
reach the equivalence point is proportional to the absolute amount of analyte 8.00 (d)
present in the analytical solution. Nevertheless, the change in pH at the equiv- pH
6.00
alence point, and thus the utility of an acid–base titration, is a function of the 4.00 (d)
(c)
analyte’s concentration in the solution being titrated. 2.00 (b)
(a)
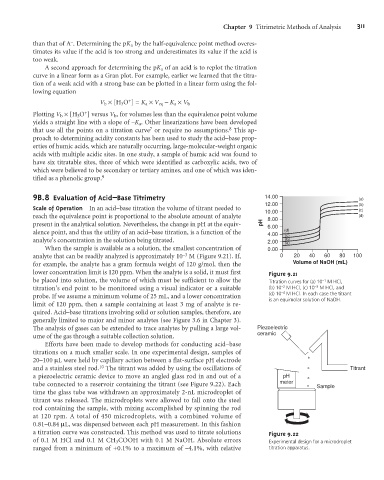
When the sample is available as a solution, the smallest concentration of 0.00
–3
analyte that can be readily analyzed is approximately 10 M (Figure 9.21). If, 0 20 40 60 80 100
for example, the analyte has a gram formula weight of 120 g/mol, then the Volume of NaOH (mL)
lower concentration limit is 120 ppm. When the analyte is a solid, it must first Figure 9.21
be placed into solution, the volume of which must be sufficient to allow the Titration curves for (a) 10 –1 M HCl,
titration’s end point to be monitored using a visual indicator or a suitable (b) 10 –2 M HCl, (c) 10 –3 M HCl, and
–4
probe. If we assume a minimum volume of 25 mL, and a lower concentration (d) 10 M HCl. In each case the titrant
is an equimolar solution of NaOH.
limit of 120 ppm, then a sample containing at least 3 mg of analyte is re-
quired. Acid–base titrations involving solid or solution samples, therefore, are
generally limited to major and minor analytes (see Figure 3.6 in Chapter 3).
The analysis of gases can be extended to trace analytes by pulling a large vol- Piezoelectric
ume of the gas through a suitable collection solution. ceramic
Efforts have been made to develop methods for conducting acid–base
titrations on a much smaller scale. In one experimental design, samples of
20–100 mL were held by capillary action between a flat-surface pH electrode
10
and a stainless steel rod. The titrant was added by using the oscillations of Titrant
a piezoelectric ceramic device to move an angled glass rod in and out of a pH
tube connected to a reservoir containing the titrant (see Figure 9.22). Each meter Sample
time the glass tube was withdrawn an approximately 2-nL microdroplet of
titrant was released. The microdroplets were allowed to fall onto the steel
rod containing the sample, with mixing accomplished by spinning the rod
at 120 rpm. A total of 450 microdroplets, with a combined volume of
0.81–0.84 mL, was dispensed between each pH measurement. In this fashion
a titration curve was constructed. This method was used to titrate solutions Figure 9.22
of 0.1 M HCl and 0.1 M CH 3 COOH with 0.1 M NaOH. Absolute errors Experimental design for a microdroplet
ranged from a minimum of +0.1% to a maximum of –4.1%, with relative titration apparatus.