
Page 88 - Modern Analytical Chemistry
P. 88
1400-CH04 9/8/99 3:54 PM Page 71
Chapter 4 Evaluating Analytical Data 71
4
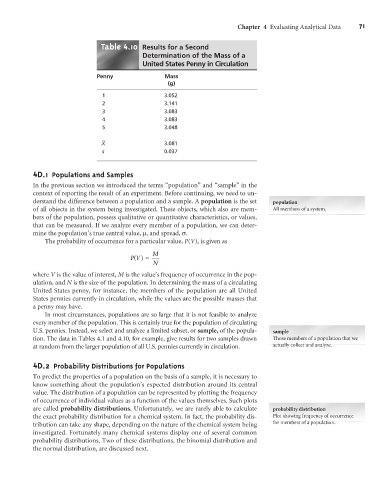
Table .10 Results for a Second
Determination of the Mass of a
United States Penny in Circulation
Penny Mass
(g)
1 3.052
2 3.141
3 3.083
4 3.083
5 3.048
–
X 3.081
s 0.037
4 D.1 Populations and Samples
In the previous section we introduced the terms “population” and “sample” in the
context of reporting the result of an experiment. Before continuing, we need to un-
derstand the difference between a population and a sample. A population is the set population
of all objects in the system being investigated. These objects, which also are mem- All members of a system.
bers of the population, possess qualitative or quantitative characteristics, or values,
that can be measured. If we analyze every member of a population, we can deter-
mine the population’s true central value, m, and spread, s.
The probability of occurrence for a particular value, P(V), is given as
M
PV() =
N
where V is the value of interest, M is the value’s frequency of occurrence in the pop-
ulation, and N is the size of the population. In determining the mass of a circulating
United States penny, for instance, the members of the population are all United
States pennies currently in circulation, while the values are the possible masses that
a penny may have.
In most circumstances, populations are so large that it is not feasible to analyze
every member of the population. This is certainly true for the population of circulating
U.S. pennies. Instead, we select and analyze a limited subset, or sample, of the popula- sample
tion. The data in Tables 4.1 and 4.10, for example, give results for two samples drawn Those members of a population that we
at random from the larger population of all U.S. pennies currently in circulation. actually collect and analyze.
4 D.2 Probability Distributions for Populations
To predict the properties of a population on the basis of a sample, it is necessary to
know something about the population’s expected distribution around its central
value. The distribution of a population can be represented by plotting the frequency
of occurrence of individual values as a function of the values themselves. Such plots
are called probability distributions. Unfortunately, we are rarely able to calculate probability distribution
the exact probability distribution for a chemical system. In fact, the probability dis- Plot showing frequency of occurrence
tribution can take any shape, depending on the nature of the chemical system being for members of a population.
investigated. Fortunately many chemical systems display one of several common
probability distributions. Two of these distributions, the binomial distribution and
the normal distribution, are discussed next.