
Page 92 - Modern Analytical Chemistry
P. 92
1400-CH04 9/8/99 3:54 PM Page 75
Chapter 4 Evaluating Analytical Data 75
0.08
0.07
0.06
f (mg aspirin) 0.05
0.04
0.03
0.02
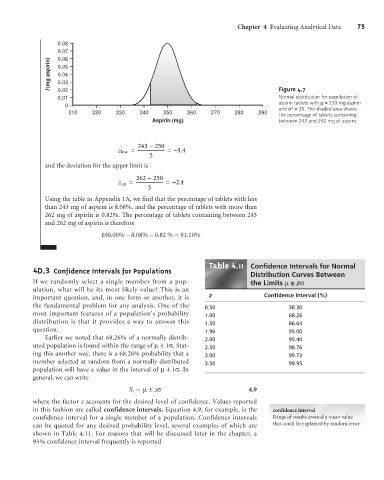
Normal distribution for population of
0.01 Figure 4.7
aspirin tablets with m= 250 mg aspirin
0
2
and s = 25. The shaded area shows
210 220 230 240 250 260 270 280 290
the percentage of tablets containing
Aspirin (mg) between 243 and 262 mg of aspirin.
243 -250
z low = =-14
.
5
and the deviation for the upper limit is
262 -250
z up = =+24
.
5
Using the table in Appendix 1A, we find that the percentage of tablets with less
than 243 mg of aspirin is 8.08%, and the percentage of tablets with more than
262 mg of aspirin is 0.82%. The percentage of tablets containing between 243
and 262 mg of aspirin is therefore
100.00% – 8.08% – 0.82 % = 91.10%
4
4 3 Confidence Intervals for Populations Table .11 Confidence Intervals for Normal
D.
Distribution Curves Between
If we randomly select a single member from a pop- the Limits m± zs
ulation, what will be its most likely value? This is an
important question, and, in one form or another, it is z Confidence Interval (%)
the fundamental problem for any analysis. One of the 0.50 38.30
most important features of a population’s probability 1.00 68.26
distribution is that it provides a way to answer this 1.50 86.64
question. 1.96 95.00
Earlier we noted that 68.26% of a normally distrib- 2.00 95.44
uted population is found within the range of m±1s. Stat- 2.50 98.76
ing this another way, there is a 68.26% probability that a 3.00 99.73
member selected at random from a normally distributed 3.50 99.95
population will have a value in the interval of m±1s. In
general, we can write
X i = m±zs 4.9
where the factor z accounts for the desired level of confidence. Values reported
in this fashion are called confidence intervals. Equation 4.9, for example, is the confidence interval
confidence interval for a single member of a population. Confidence intervals Range of results around a mean value
can be quoted for any desired probability level, several examples of which are that could be explained by random error.
shown in Table 4.11. For reasons that will be discussed later in the chapter, a
95% confidence interval frequently is reported.