
Page 95 - Modern Analytical Chemistry
P. 95
1400-CH04 9/8/99 3:54 PM Page 78
78 Modern Analytical Chemistry
4
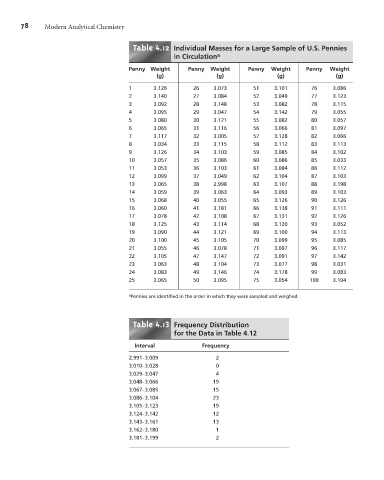
Table .12 Individual Masses for a Large Sample of U.S. Pennies
in Circulation a
Penny Weight Penny Weight Penny Weight Penny Weight
(g) (g) (g) (g)
1 3.126 26 3.073 51 3.101 76 3.086
2 3.140 27 3.084 52 3.049 77 3.123
3 3.092 28 3.148 53 3.082 78 3.115
4 3.095 29 3.047 54 3.142 79 3.055
5 3.080 30 3.121 55 3.082 80 3.057
6 3.065 31 3.116 56 3.066 81 3.097
7 3.117 32 3.005 57 3.128 82 3.066
8 3.034 33 3.115 58 3.112 83 3.113
9 3.126 34 3.103 59 3.085 84 3.102
10 3.057 35 3.086 60 3.086 85 3.033
11 3.053 36 3.103 61 3.084 86 3.112
12 3.099 37 3.049 62 3.104 87 3.103
13 3.065 38 2.998 63 3.107 88 3.198
14 3.059 39 3.063 64 3.093 89 3.103
15 3.068 40 3.055 65 3.126 90 3.126
16 3.060 41 3.181 66 3.138 91 3.111
17 3.078 42 3.108 67 3.131 92 3.126
18 3.125 43 3.114 68 3.120 93 3.052
19 3.090 44 3.121 69 3.100 94 3.113
20 3.100 45 3.105 70 3.099 95 3.085
21 3.055 46 3.078 71 3.097 96 3.117
22 3.105 47 3.147 72 3.091 97 3.142
23 3.063 48 3.104 73 3.077 98 3.031
24 3.083 49 3.146 74 3.178 99 3.083
25 3.065 50 3.095 75 3.054 100 3.104
a Pennies are identified in the order in which they were sampled and weighed.
4 3
Table .1 Frequency Distribution
for the Data in Table 4.12
Interval Frequency
2.991–3.009 2
3.010–3.028 0
3.029–3.047 4
3.048–3.066 19
3.067–3.085 15
3.086–3.104 23
3.105–3.123 19
3.124–3.142 12
3.143–3.161 13
3.162–3.180 1
3.181–3.199 2