
Page 99 - Modern Analytical Chemistry
P. 99
1400-CH04 9/8/99 3:54 PM Page 82
82 Modern Analytical Chemistry
making the confidence interval too broad, or you may conclude that the analyte’s
concentration is too small to detect accurately.*
A second example is also informative. When samples are obtained from a nor-
mally distributed population, their values must be random. If results for several
samples show a regular pattern or trend, then the samples cannot be normally dis-
tributed. This may reflect the fact that the underlying population is not normally
distributed, or it may indicate the presence of a time-dependent determinate error.
For example, if we randomly select 20 pennies and find that the mass of each penny
exceeds that of the preceding penny, we might suspect that the balance on which
the pennies are being weighed is drifting out of calibration.
4 E Statistical Analysis of Data
In the previous section we noted that the result of an analysis is best expressed as a
confidence interval. For example, a 95% confidence interval for the mean of five re-
sults gives the range in which we expect to find the mean for 95% of all samples of
equal size, drawn from the same population. Alternatively, and in the absence of de-
terminate errors, the 95% confidence interval indicates the range of values in which
we expect to find the population’s true mean.
The probabilistic nature of a confidence interval provides an opportunity to ask
and answer questions comparing a sample’s mean or variance to either the accepted
values for its population or similar values obtained for other samples. For example,
confidence intervals can be used to answer questions such as “Does a newly devel-
oped method for the analysis of cholesterol in blood give results that are signifi-
cantly different from those obtained when using a standard method?” or “Is there a
significant variation in the chemical composition of rainwater collected at different
sites downwind from a coalburning utility plant?” In this section we introduce a
Values
general approach to the statistical analysis of data. Specific statistical methods of
(a)
analysis are covered in Section 4F.
4 E.1 Significance Testing
Let’s consider the following problem. Two sets of blood samples have been collected
from a patient receiving medication to lower her concentration of blood glucose.
One set of samples was drawn immediately before the medication was adminis-
Values tered; the second set was taken several hours later. The samples are analyzed and
(b) their respective means and variances reported. How do we decide if the medication
was successful in lowering the patient’s concentration of blood glucose?
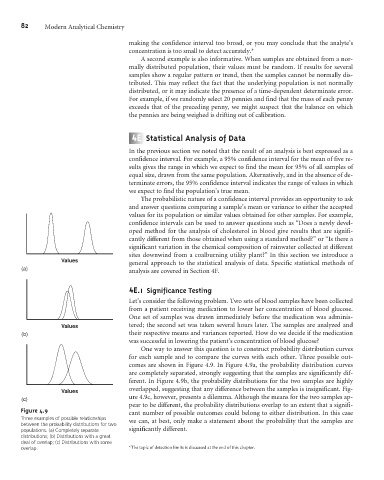
One way to answer this question is to construct probability distribution curves
for each sample and to compare the curves with each other. Three possible out-
comes are shown in Figure 4.9. In Figure 4.9a, the probability distribution curves
are completely separated, strongly suggesting that the samples are significantly dif-
ferent. In Figure 4.9b, the probability distributions for the two samples are highly
overlapped, suggesting that any difference between the samples is insignificant. Fig-
Values
ure 4.9c, however, presents a dilemma. Although the means for the two samples ap-
(c)
pear to be different, the probability distributions overlap to an extent that a signifi-
Figure 4.9 cant number of possible outcomes could belong to either distribution. In this case
Three examples of possible relationships we can, at best, only make a statement about the probability that the samples are
between the probability distributions for two
populations. (a) Completely separate significantly different.
distributions; (b) Distributions with a great
deal of overlap; (c) Distributions with some
overlap. *The topic of detection limits is discussed at the end of this chapter.