
Page 98 - Modern Analytical Chemistry
P. 98
1400-CH04 9/8/99 3:54 PM Page 81
Chapter 4 Evaluating Analytical Data 81
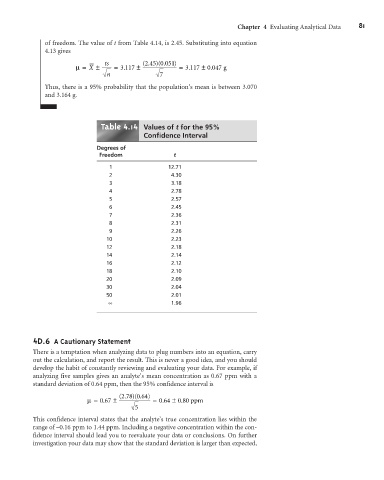
of freedom. The value of t from Table 4.14, is 2.45. Substituting into equation
4.13 gives
2 45 0 051)
ts (. ) ( .
m=X ± =3 117 ± = 3 117 0 ±047 g
.
.
.
n 7
Thus, there is a 95% probability that the population’s mean is between 3.070
and 3.164 g.
4 4
Table .1 Values of t for the 95%
Confidence Interval
Degrees of
Freedom t
1 12.71
2 4.30
3 3.18
4 2.78
5 2.57
6 2.45
7 2.36
8 2.31
9 2.26
10 2.23
12 2.18
14 2.14
16 2.12
18 2.10
20 2.09
30 2.04
50 2.01
∞ 1.96
4 D.6 A Cautionary Statement
There is a temptation when analyzing data to plug numbers into an equation, carry
out the calculation, and report the result. This is never a good idea, and you should
develop the habit of constantly reviewing and evaluating your data. For example, if
analyzing five samples gives an analyte’s mean concentration as 0.67 ppm with a
standard deviation of 0.64 ppm, then the 95% confidence interval is
278 0 64)
(. ) ( .
.
.
±80 p
m=067 ± =064 0 . pm
5
This confidence interval states that the analyte’s true concentration lies within the
range of –0.16 ppm to 1.44 ppm. Including a negative concentration within the con-
fidence interval should lead you to reevaluate your data or conclusions. On further
investigation your data may show that the standard deviation is larger than expected,