
Page 101 - Modern Analytical Chemistry
P. 101
1400-CH04 9/8/99 3:54 PM Page 84
84 Modern Analytical Chemistry
4 3 One-Tailed and Two-Tailed Significance Tests
E.
Consider the situation when the accuracy of a new analytical method is evaluated by
analyzing a standard reference material with a known m. A sample of the standard is
analyzed, and the sample’s mean is determined. The null hypothesis is that the sam-
ple’s mean is equal to m
–
Values H 0 : X = m
(a)
If the significance test is conducted at the 95% confidence level (a= 0.05), then the
–
null hypothesis will be retained if a 95% confidence interval around X contains m. If
the alternative hypothesis is
–
H A : X ≠ m
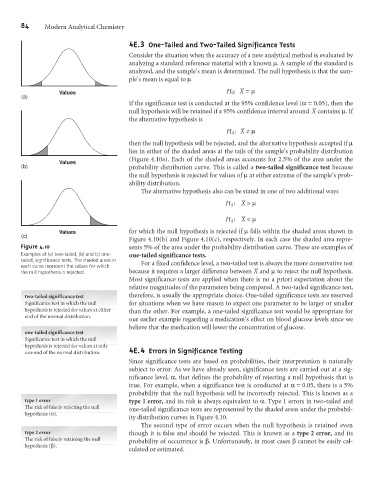
then the null hypothesis will be rejected, and the alternative hypothesis accepted if m
lies in either of the shaded areas at the tails of the sample’s probability distribution
(Figure 4.10a). Each of the shaded areas accounts for 2.5% of the area under the
Values
(b) probability distribution curve. This is called a two-tailed significance test because
the null hypothesis is rejected for values of mat either extreme of the sample’s prob-
ability distribution.
The alternative hypothesis also can be stated in one of two additional ways
–
H A : X > m
–
H A : X < m
Values for which the null hypothesis is rejected if mfalls within the shaded areas shown in
(c)
Figure 4.10(b) and Figure 4.10(c), respectively. In each case the shaded area repre-
Figure 4.10 sents 5% of the area under the probability distribution curve. These are examples of
Examples of (a) two-tailed, (b) and (c) one- one-tailed significance tests.
tailed, significance tests. The shaded areas in
each curve represent the values for which For a fixed confidence level, a two-tailed test is always the more conservative test
–
the null hypothesis is rejected. because it requires a larger difference between X and mto reject the null hypothesis.
Most significance tests are applied when there is no a priori expectation about the
relative magnitudes of the parameters being compared. A two-tailed significance test,
two-tailed significance test therefore, is usually the appropriate choice. One-tailed significance tests are reserved
Significance test in which the null for situations when we have reason to expect one parameter to be larger or smaller
hypothesis is rejected for values at either than the other. For example, a one-tailed significance test would be appropriate for
end of the normal distribution.
our earlier example regarding a medication’s effect on blood glucose levels since we
believe that the medication will lower the concentration of glucose.
one-tailed significance test
Significance test in which the null
hypothesis is rejected for values at only 4 4
one end of the normal distribution. E. Errors in Significance Testing
Since significance tests are based on probabilities, their interpretation is naturally
subject to error. As we have already seen, significance tests are carried out at a sig-
nificance level, a, that defines the probability of rejecting a null hypothesis that is
true. For example, when a significance test is conducted at a= 0.05, there is a 5%
probability that the null hypothesis will be incorrectly rejected. This is known as a
type 1 error type 1 error, and its risk is always equivalent to a. Type 1 errors in two-tailed and
The risk of falsely rejecting the null one-tailed significance tests are represented by the shaded areas under the probabil-
hypothesis (a).
ity distribution curves in Figure 4.10.
The second type of error occurs when the null hypothesis is retained even
type 2 error though it is false and should be rejected. This is known as a type 2 error, and its
The risk of falsely retaining the null probability of occurrence is b. Unfortunately, in most cases bcannot be easily cal-
hypothesis (b).
culated or estimated.