
Page 254 - Modern Derivatization Methods for Separation Sciences
P. 254
Document Página 1 de 2
Page 118
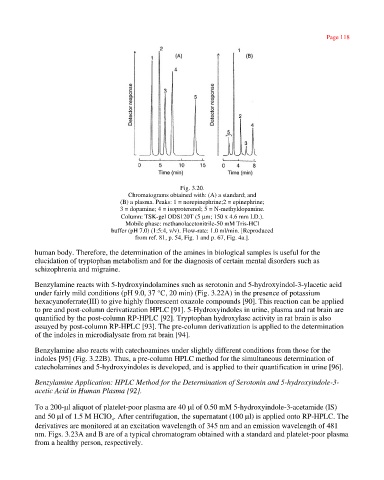
Fig. 3.20.
Chromatograms obtained with: (A) a standard; and
(B) a plasma. Peaks: 1 = norepinephrine;2 = epinephrine;
3 = dopamine; 4 = isoproterenol; 5 = N-methyldopamine.
Column: TSK-gel ODS120T (5 µm; 150 x 4.6 mm I.D.).
Mobile phase: methanolacetonitrile-50 mM Tris-HCl
buffer (pH 7.0) (1:5:4, v/v). Flow-rate: 1.0 ml/min. [Reproduced
from ref. 81, p. 54, Fig. 1 and p. 67, Fig. 4a.].
human body. Therefore, the determination of the amines in biological samples is useful for the
elucidation of tryptophan metabolism and for the diagnosis of certain mental disorders such as
schizophrenia and migraine.
Benzylamine reacts with 5-hydroxyindolamines such as serotonin and 5-hydroxyindol-3-ylacetic acid
under fairly mild conditions (pH 9.0, 37 °C, 20 min) (Fig. 3.22A) in the presence of potassium
hexacyanoferrate(III) to give highly fluorescent oxazole compounds [90]. This reaction can be applied
to pre and post-column derivatization HPLC [91]. 5-Hydroxyindoles in urine, plasma and rat brain are
quantified by the post-column RP-HPLC [92]. Tryptophan hydroxylase activity in rat brain is also
assayed by post-column RP-HPLC [93]. The pre-column derivatization is applied to the determination
of the indoles in microdialysate from rat brain [94].
Benzylamine also reacts with catechoamines under slightly different conditions from those for the
indoles [95] (Fig. 3.22B). Thus, a pre-column HPLC method for the simultaneous determination of
catecholamines and 5-hydroxyindoles is developed, and is applied to their quantification in urine [96].
Benzylamine Application: HPLC Method for the Determination of Serotonin and 5-hydroxyindole-3-
acetic Acid in Human Plasma [92].
To a 200-µl aliquot of platelet-poor plasma are 40 µl of 0.50 mM 5-hydroxyindole-3-acetamide (IS)
and 50 µl of 1.5 M HCIO . After centrifugation, the supernatant (100 µl) is applied onto RP-HPLC. The
4
derivatives are monitored at an excitation wavelength of 345 nm and an emission wavelength of 481
nm. Figs. 3.23A and B are of a typical chromatogram obtained with a standard and platelet-poor plasma
from a healthy person, respectively.
http://emedia.netlibrary.com/nlreader/nlreader.dll?bookid=17968&filename=Page_118.ht... 30/09/2003