
Page 347 - MODERN ELECTROCHEMISTRY
P. 347
ION–ION INTERACTIONS 283
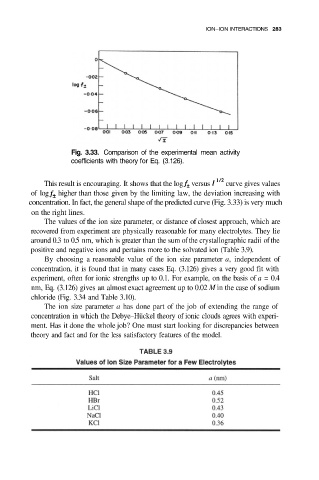
Fig. 3.33. Comparison of the experimental mean activity
coefficients with theory for Eq. (3.126).
This result is encouraging. It shows that the log versus curve gives values
of log higher than those given by the limiting law, the deviation increasing with
concentration. In fact, the general shape of the predicted curve (Fig. 3.33) is very much
on the right lines.
The values of the ion size parameter, or distance of closest approach, which are
recovered from experiment are physically reasonable for many electrolytes. They lie
around 0.3 to 0.5 nm, which is greater than the sum of the crystallographic radii of the
positive and negative ions and pertains more to the solvated ion (Table 3.9).
By choosing a reasonable value of the ion size parameter a, independent of
concentration, it is found that in many cases Eq. (3.126) gives a very good fit with
experiment, often for ionic strengths up to 0.1. For example, on the basis of a = 0.4
nm, Eq. (3.126) gives an almost exact agreement up to 0.02 M in the case of sodium
chloride (Fig. 3.34 and Table 3.10).
The ion size parameter a has done part of the job of extending the range of
concentration in which the Debye–Hückel theory of ionic clouds agrees with experi-
ment. Has it done the whole job? One must start looking for discrepancies between
theory and fact and for the less satisfactory features of the model.