
Page 135 - Modern Optical Engineering The Design of Optical Systems
P. 135
118 Chapter Six
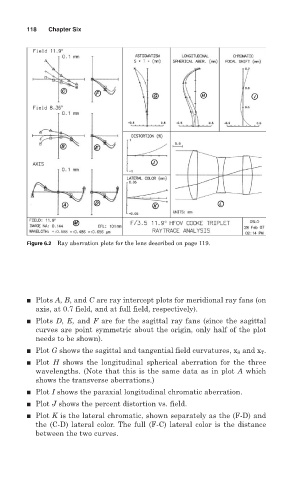
Figure 6.2 Ray aberration plots for the lens described on page 119.
■ Plots A, B, and C are ray intercept plots for meridional ray fans (on
axis, at 0.7 field, and at full field, respectively).
■ Plots D, E, and F are for the sagittal ray fans (since the sagittal
curves are point symmetric about the origin, only half of the plot
needs to be shown).
■ Plot G shows the sagittal and tangential field curvatures, x S and x T .
■ Plot H shows the longitudinal spherical aberration for the three
wavelengths. (Note that this is the same data as in plot A which
shows the transverse aberrations.)
■ Plot I shows the paraxial longitudinal chromatic aberration.
■ Plot J shows the percent distortion vs. field.
■ Plot K is the lateral chromatic, shown separately as the (F-D) and
the (C-D) lateral color. The full (F-C) lateral color is the distance
between the two curves.