
Page 198 - Modern Spatiotemporal Geostatistics
P. 198
Modifications of BME Analysis 179
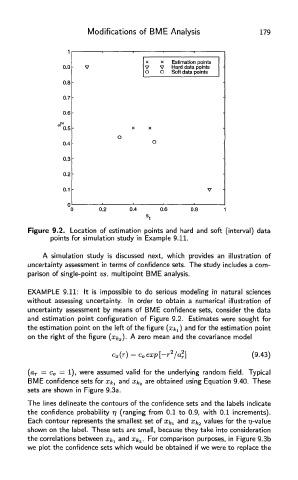
Figure 9.2. Location of estimation points and hard and soft (interval) data
points for simulation study in Example 9.11.
A simulation study is discussed next, which provides an illustration of
uncertainty assessment in terms of confidence sets. The study includes a com-
parison of single-point vs. multipoint BME analysis.
EXAMPLE 9.11: It is impossible to do serious modeling in natural sciences
without assessing uncertainty. In order to obtain a numerical illustration of
uncertainty assessment by means of BME confidence sets, consider the data
and estimation point configuration of Figure 9.2. Estimates were sought for
the estimation point on the left of the figure (xfcj) and for the estimation point
on the right of the figure (xk 2)- A zero mean and the covariance model
(a r = c 0 — 1), were assumed valid for the underlying random field. Typical
BME confidence sets for x^ and Xk 2 are obtained using Equation 9.40. These
sets are shown in Figure 9.3a.
The lines delineate the contours of the confidence sets and the labels indicate
the confidence probability 77 (ranging from 0.1 to 0.9, with 0.1 increments
Each contour represents the smallest set of x^ and Xk 2 values for the Tj-value
shown on the label. These sets are small, because they take into consideration
the correlations between x^ and Xk 3. For comparison purposes, in Figure 9.3b
we plot the confidence sets which would be obtained if we were to replace the