
Page 201 - Modern Spatiotemporal Geostatistics
P. 201
182 Modern Spatiotemporal Geostatistics — Chapter 9
The !J-[ = 0 defines a critical hypersurface in the A-dimensional space. The
reliability index /3 of the system may be generally defined as the minimum
distance from the origin to the critical hypersurface. The meaning of /? is
better illustrated by means of an example.
EXAMPLE 9.12: The case of thermal pollution in a river, e.g., may be modeled
in terms of Equation 9.44 with 9{(X) = X\ — X%, where X\ represents a
fraction of the natural flow in the river, and X 2 denotes the discharge from the
cooling system of a thermal power plant flowing into the river (Kottegoda and
Rosso, 1997). In this simple case we find /3 = tya^, which may be interpreted
as the number of a^'s between ^and the critical value J{= 0. In the more
general case in which
the corresponding reliabilty index is given by
where CTJ and <jj are the standard deviations of X^ and Xj, respectively,
and pij are correlation functions between X, and Xj (i, j = 1, ..., A).
All the statistics involved in Equation 9.47 are calculated in terms of BME
analysis.
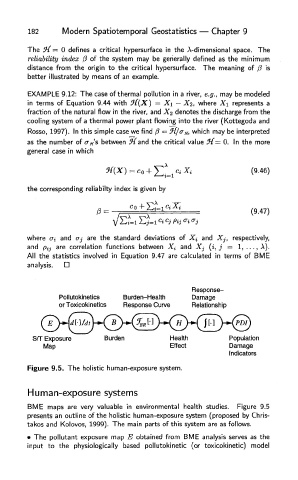
Figure 9.5. The holistic human-exposure system.
Human-exposure systems
BME maps are very valuable in environmental health studies. Figure 9.5
presents an outline of the holistic human-exposure system (proposed by Chris-
takos and Kolovos, 1999). The main parts of this system are as follows.
• The pollutant exposure map E obtained from BME analysis serves as the
input to the physiologically based pollutokinetic (or toxicokinetic) model