
Page 203 - Modern Spatiotemporal Geostatistics
P. 203
184 Modern Spatiotemporal Geostatistics — Chapter 9
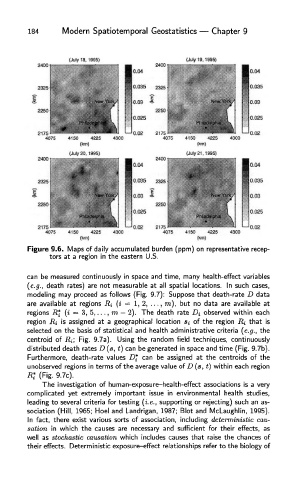
Figure 9.6. Maps of daily accumulated burden (ppm) on representative recep-
tors at a region in the eastern U.S.
can be measured continuously in space and time, many health-effect variables
(e.g., death rates) are not measurable at all spatial locations. In such cases,
modeling may proceed as follows (Fig. 9.7): Suppose that death-rate D data
are available at regions Ri (i = 1, 2, ..., m), but no data are available at
regions R* (i = 3, 5,..., m - 2). The death rate D t observed within each
region Ri is assigned at a geographical location Si of the region Ri that is
selected on the basis of statistical and health administrative criteria (e.g., the
centroid of R^; Fig. 9.7a). Using the random field techniques, continuously
distributed death rates D (s, t) can be generated in space and time (Fig. 9.7b).
Furthermore, death-rate values D* can be assigned at the centroids of the
unobserved regions in terms of the average value of D (s, t) within each region
R* (Fig. 9.7c).
The investigation of human-exposure-health-effect associations is a very
complicated yet extremely important issue in environmental health studies,
leading to several criteria for testing (i.e., supporting or rejecting) such an as-
sociation (Hill, 1965; Hoel and Landrigan, 1987; Blot and Mclaughlin, 1995).
In fact, there exist various sorts of association, including deterministic cau-
sation in which the causes are necessary and sufficient for their effects, as
well as stochastic causation which includes causes that raise the chances of
their effects. Deterministic exposure-effect relationships refer to the biology of