
Page 213 - Modern Spatiotemporal Geostatistics
P. 213
194 Modern Spatiotemporal Geostatistics — Chapter 9
higher levels of PMio were correlated with higher death rates. The correspond-
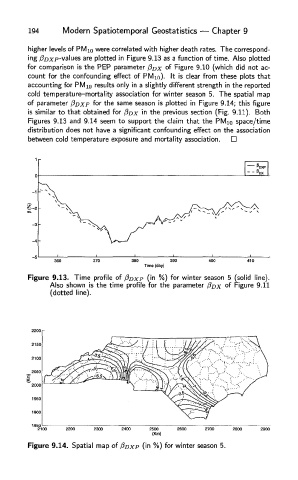
ing /foxp-values are plotted in Figure 9.13 as a function of time. Also plotted
for comparison is the PEP parameter PDX of Figure 9.10 (which did not ac-
count for the confounding effect of PMio). It is clear from these plots that
accounting for PMio results only in a slightly different strength in the reported
cold temperature-mortality association for winter season 5. The spatial map
of parameter PDXP for the same season is plotted in Figure 9.14; this figure
is similar to that obtained for @DX in the previous section (Fig. 9.11). Both
Figures 9.13 and 9.14 seem to support the claim that the PMio space/time
distribution does not have a significant confounding effect on the association
between cold temperature exposure and mortality association.
Figure 9.13. Time profile of PDXP (in %) for winter season 5 (solid line).
Also shown is the time profile for the parameter PDX of Figure 9.11
(dotted line).
Figure 9.14. Spatial map of PDXP (in %) for winter season 5.