
Page 210 - Modern Spatiotemporal Geostatistics
P. 210
Modifications of BME Analysis 191
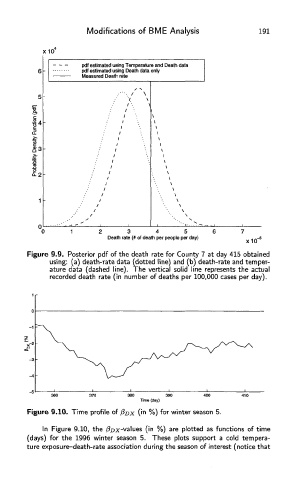
Figure 9.9. Posterior pdf of the death rate for County 7 at day 415 obtained
using: (a) death-rate data (dotted line) and (b) death-rate and temper-
ature data (dashed line). The vertical solid line represents the actual
recorded death rate (in number of deaths per 100,000 cases per day).
Figure 9.10. Time profile of PDX (in %) for winter season 5.
In Figure 9.10, the /3ox-values (in %) are plotted as functions of time
(days) for the 1996 winter season 5. These plots support a cold tempera-
ture exposure-death-rate association during the season of interest (notice that