
Page 211 - Modern Spatiotemporal Geostatistics
P. 211
192 Modern Spatiotemporal Geostatistics — Chapter 9
the PDX is consistently negative). Moreover, the PDX magnitude is indica-
tive of the strength of this association as a function of time. As is shown
in Figure 9.10, the temperature exposure-death-rate association is of varying
magnitude during winter season 5.
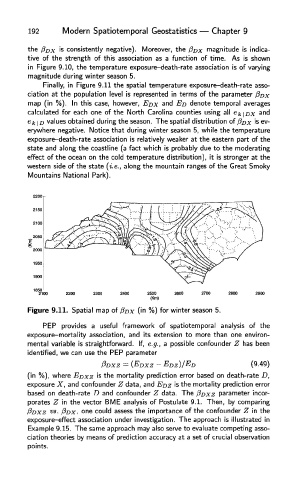
Finally, in Figure 9.11 the spatial temperature exposure-death-rate asso-
ciation at the population level is represented in terms of the parameter PDX
map (in %). In this case, however, EDX and ED denote temporal averages
calculated for each one of the North Carolina counties using all e^\DX an d
e k\ D values obtained during the season. The spatial distribution of flux is ev-
erywhere negative. Notice that during winter season 5, while the temperature
exposure-death-rate association is relatively weaker at the eastern part of the
state and along the coastline (a fact which is probably due to the moderating
effect of the ocean on the cold temperature distribution), it is stronger at the
western side of the state (i.e., along the mountain ranges of the Great Smoky
Mountains National Park).
Figure 9.11. Spatial map of (3ox (in %) for winter season 5.
PEP provides a useful framework of spatiotemporal analysis of the
exposure-mortality association, and its extension to more than one environ-
mental variable is straightforward. If, e.g., a possible confounder Z has been
identified, we can use the PEP parameter
(in %), where EDXZ is the mortality prediction error based on death-rate D,
exposure X, and confounder Z data, and EDZ is the mortality prediction error
based on death-rate D and confounder Z data. The $DXZ parameter incor-
porates Z in the vector BME analysis of Postulate 9.1. Then, by comparing
PDXZ vs. PDX, one could assess the importance of the confounder Z in the
exposure-effect association under investigation. The approach is illustrated in
Example 9.15. The same approach may also serve to evaluate competing asso-
ciation theories by means of prediction accuracy at a set of crucial observation
points.