
Page 63 - Modern physical chemistry
P. 63
52 Gases and Collective Properties
Substances with low boiling points, such as hydrogen and helium, have low critical ratios,
while substances that associate in the liquid state, such as ethyl alcohol and water, have
high ratios.
3.11 Compressibility Factor for a Gas
Instead of plotting experimental Vragainst P r and Tn to represent (3.66), one may con-
veniently plot PVIRT against these independent variables. This ratio is known as the com-
pressibility factor.
First, we note that a general equation of state can be constructed by introducing a
factor z on the right side of the ideal-gas equation:
PV=znRT. [3.69]
Solving for z with n equal to one mole leads to
PV PcVc PrVr
z=-=----. [3.70]
RT RTc Tr
But according to the law of corresponding states, the first fraction on the right is con-
stant while the second fraction is a function of the reduced pressure and reduced tem-
perature. Thus, z itself is a function of Prand Tr.
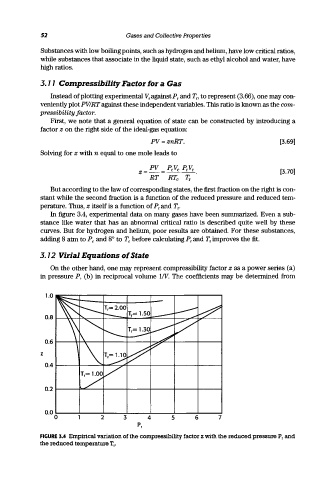
In figure 3.4, experimental data on many gases have been summarized. Even a sub-
stance like water that has an abnormal critical ratio is described quite well by these
curves. But for hydrogen and helium, poor results are obtained. For these substances,
adding 8 atm to Pc and 8° to To before calculating Pr and Tr improves the fit.
3.12 Virial Equations of State
On the other hand, one may represent compressibility factor z as a power series (a)
in pressure P, (b) in reciprocal volume IN. The coefficients may be determined from
1.0
0.8
0.6
z
0.4
0.2
0.0
0 2 3 4 5 6 7
P r
FIGURE 3.4 Empirical variation of the compressibility factor z with the reduced pressure P r and
the reduced temperature T r •