
Page 148 - Multidimensional Chromatography
P. 148
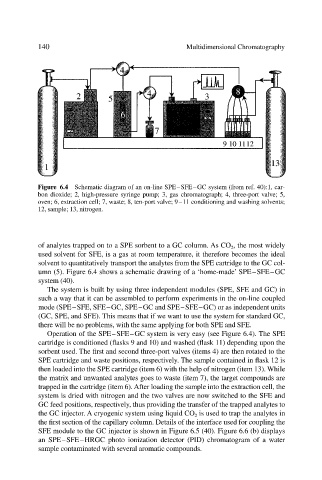
140                                     Multidimensional Chromatography


                           Figure 6.4 Schematic diagram of an on-line SPE–SFE–GC system (from ref. 40):1, car-
                           bon dioxide; 2, high-pressure syringe pump; 3, gas chromatograph; 4, three-port valve; 5,
                           oven; 6, extraction cell; 7, waste; 8, ten-port valve; 9–11 conditioning and washing solvents;
                           12, sample; 13, nitrogen.


                           of analytes trapped on to a SPE sorbent to a GC column. As CO 2 , the most widely
                           used solvent for SFE, is a gas at room temperature, it therefore becomes the ideal
                           solvent to quantitatively transport the analytes from the SPE cartridge to the GC col-
                           umn (5). Figure 6.4 shows a schematic drawing of a ‘home-made’ SPE–SFE–GC
                           system (40).
                              The system is built by using three independent modules (SPE, SFE and GC) in
                           such a way that it can be assembled to perform experiments in the on-line coupled
                           mode (SPE–SFE, SFE–GC, SPE–GC and SPE–SFE–GC) or as independent units
                           (GC, SPE, and SFE). This means that if we want to use the system for standard GC,
                           there will be no problems, with the same applying for both SPE and SFE.
                              Operation of the SPE–SFE–GC system is very easy (see Figure 6.4). The SPE
                           cartridge is conditioned (flasks 9 and 10) and washed (flask 11) depending upon the
                           sorbent used. The first and second three-port valves (items 4) are then rotated to the
                           SPE cartridge and waste positions, respectively. The sample contained in flask 12 is
                           then loaded into the SPE cartridge (item 6) with the help of nitrogen (item 13). While
                           the matrix and unwanted analytes goes to waste (item 7), the target compounds are
                           trapped in the cartridge (item 6). After loading the sample into the extraction cell, the
                           system is dried with nitrogen and the two valves are now switched to the SFE and
                           GC feed positions, respectively, thus providing the transfer of the trapped analytes to
                           the GC injector. A cryogenic system using liquid CO 2 is used to trap the analytes in
                           the first section of the capillary column. Details of the interface used for coupling the
                           SFE module to the GC injector is shown in Figure 6.5 (40). Figure 6.6 (b) displays
                           an SPE–SFE–HRGC photo ionization detector (PID) chromatogram of a water
                           sample contaminated with several aromatic compounds.